Previous Chapter Tutorial Home Next Chapter
The behavior of a typical routine in an NCAR Graphics utility is sometimes determined entirely by the routine's arguments, but frequently it is also affected by the value of one or more of the utility's parameters. A "parameter" is a variable that controls the behavior of a utility; parameters are accessed via parameter-access routines that can set or retrieve the parameter value.
Instructions for setting and retrieving Ezmap parameters are provided in module "Mp 1.9 Ezmap parameters: What they do and how to use them."
----------------------------------------------------------------------------------------
Parameter  Brief description                        Fortran type  Examples  Module
----------------------------------------------------------------------------------------
AR         ARea                                     Character     ---       Mp 7.
C1         Color index 1 (for perimeter)            Integer       cmpclr    Mp 2.6
C2         Color index 2 (for grid)                 Integer       cmpclr    Mp 2.6
C3         Color index 3 (for labels)               Integer       cmpclr    Mp 2.6
C4         Color index 4 (for limb line)            Integer       cmpclr    Mp 2.6
C5         Color index 5 (for continents)           Integer       cmpclr    Mp 2.6
C6         Color index 6 (for US states)            Integer       cmpclr    Mp 2.6
C7         Color index 7 (for countries)            Integer       cmpclr    Mp 2.6
DA         grid DAshline pattern                    Integer       cmpdd     Mp 3.3
DD         Distance between Dots                    Real          cmplot    Mp 3.5
DL         Dotted Line flag                         Integer       ---       Mp 7.
DO         Dotted Outline flag                      Integer       cmplot    Mp 3.5
EL         ELliptical perimeter flag                Integer       cmpel     Mp 2.9
ER         ERror                                    Integer       ---       Mp 7.
G1         Group 1 (group identifier for geo        Integer       cmpgrp    Mp 4.2
           graphic entities and perimeter)
G2         Group 2 (group identifier for vertical   Integer       cmpgrp    Mp 4.2
           strips)
GD         Grid Drawing resolution                  Real          cmpgrd    Mp 3.2
GR         GRid spacing                             Real          cmpgrd    Mp 3.2
IN         INitialization flag                      Integer       ---       Mp 7.
LA         meridian/pole LAbel flag                 Integer       cmplbl,   Mp 3.4,
                                                                  cmplab    Mp 4.4
LS         Label Size                               Integer       cmplbl,   Mp 3.4,
                                                                  cmplab    Mp 4.4
MV         Minimum Vector length                    Real          cmplot    Mp 3.5
OU         OUtline data flag                        Character     cmpou     Mp 2.4
P1         PLM1(1) value                            Real          ---       Mp 7.
P2         PLM2(1) value                            Real          ---       Mp 7.
P3         PLM3(1) value                            Real          ---       Mp 7.
P4         PLM4(1) value                            Real          ---       Mp 7.
P5         PLM1(2) value                            Real          ---       Mp 7.
P6         PLM2(2) value                            Real          ---       Mp 7.
P7         PLM3(2) value                            Real          ---       Mp 7.
P8         PLM4(2) value                            Real          ---       Mp 7.
PE         PErimeter flag                           Integer       cmpel     Mp 2.9
PN         PLON value                               Real          ---       Mp 7.
PR         PRojection specifier value               Character     ---       Mp 7.
PT         PLAT value                               Real          ---       Mp 7.
RE         REsolution                               Integer       cmplot    Mp 3.5
RO         ROtation                                 Real          ---       Mp 7.
SA         SAtellite view distance                  Real          cmpsat    Mp 2.3
S1         Satellite viewing angle                  Real          cmpsat    Mp 2.3
S2         Satellite view projection                Real          cmpsat    Mp 2.3
SR         lat/lon Search Radius                    Real          ---       Mp 7.
VS         Vertical-Stripping parameter             Integer       cmpgrp    Mp 4.2
XL         XLOW value                               Real          ---       Mp 7.
XR         XROW value                               Real          ---       Mp 7.
YB         YBOW value                               Real          ---       Mp 7.
YT         YTOW value                               Real          ---       Mp 7.
----------------------------------------------------------------------------------------
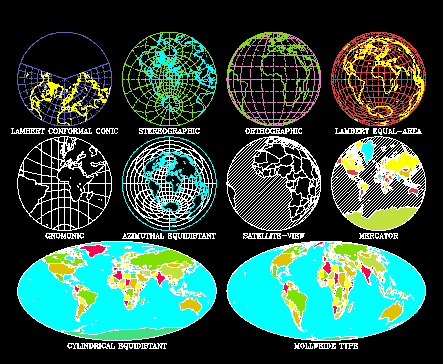
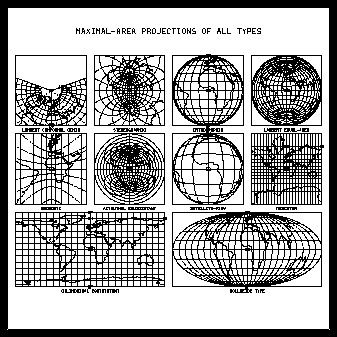
--------------------------------------------------
Abbreviation  Projection               Type
--------------------------------------------------
LC            Lambert Conformal        Conic
ST            STereographic            Azimuthal
OR            ORthographic             Azimuthal
LE            Lambert Equal-area       Azimuthal
GN            GNomonic                 Azimuthal
AE            Azimuthal Equidistant    Azimuthal
SV            Satellite View           Azimuthal
CE            Cylindrical Equidistant  Cylindrical
ME            MErcator                 Cylindrical
MO            MOllweide-type           Cylindrical
--------------------------------------------------
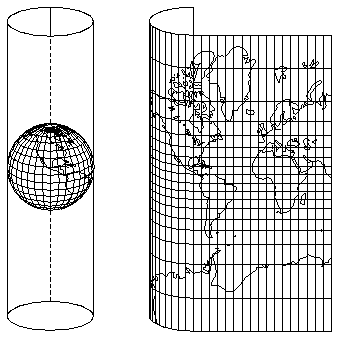
Ezmap uses three different kinds of projections to project maps of the Earth onto a two-dimensional surface: conic, azimuthal, and cylindrical. Conic projections map the surface of the earth onto a cone which is either tangent to the earth along a single circle or intersects it along two different circles. The cone is then cut from point to mouth, and spread out flat.

Mathematically, if LAT1 and LAT2 are the latitudes where the cone passes through the globe, and LAT1<>LAT2, then the "cone constant" is given by:
           LOG (COS(LAT1)) - LOG (COS(LAT2))
    CONE = -------------------------------------------------
           LOG (TAN (45-S*LAT1/2)) - LOG (TAN (45-S*LAT2/2))
where S=1 in the northern hemisphere, and S=-1 in the southern hemisphere.CONE*360 is the angular separation between the edges of the cut after the cone is opened onto the plane, as measured across the surface of the flattened cone. If (RLAT, RLON) is a point to be projected, then the following formulas give the coordinates of the projected point in the plotter plane.
    R = (TAN (45-S * RLAT/2)) ** CONE
    U = R * SIN (CONE * (RLON-CLON))
    V = -S * R * COS (CONE * (RLON-CLON))
where CLON is the longitude of the central meridian.If LAT1=LAT2, then the cone is tangent to the globe along the single standard parallel and
CONE = COS (90 - S * LAT1)
The vertex of the cone is at a distance from the plane of the equator given by D=R/SIN(LAT1), where R is the radius of the earth and LAT1 is the latitude of the single standard parallel. Note that as LAT1 approaches zero, D approaches infinity, and, as LAT1 approaches 90 degrees, D approaches R, the radius of the earth.The entire globe projects onto the u/v plane minus a wedge with its apex at the origin. This projection is best used to depict midlatitude regions of limited extent, where it is relatively free of distortion. The Lambert Conformal projection preserves angles. A portion of the u/v plane determined by the MAPSET call is the user coordinate system for drawing.
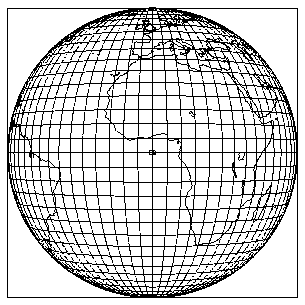
The second kind of projection that Ezmap uses to project a map of the earth onto the plotter frame is the azimuthal projection. Azimuthal projections map the globe onto a plane whose origin touches the earth at the user-specified point (PLAT, PLON). The image may be rotated by the user-specified angle ROTA.

R = TAN(A/2) = (1-COS(A)) / SIN(A)
R = SIN(A)
R = 2 * SIN(A) / SQRT(2*(1+COS(A))
R = TAN(A)
R = A * � / 180.0
R = SQRT(SA*SA-1)*SIN(A)/(SA-COS(A))
The third kind of projection Ezmap uses to project a map of the earth onto the plotter frame is the cylindrical projection. Cylindrical projections map the earth onto a cylinder that is tangent to the earth along a great circle passing through the user-specified point (PLAT, PLON) and tilted at the user-specified angle ROTA.
    U = RLAT
    V = RLON
U = RLON * �/180.0
V = ALOG (COT (45 - RLAT/2))
    U = RLON/90
    V = COS (90-RLAT)
Lee, Tso-Hwa, "Students' Summary Reports, Work-Study Program in Scientific Computing," NCAR, 1968.
Parker, R.L., "2UCSD SUPERMAP: World Plotting Package."
Steers, J.A., An Introduction to the Study of Map Projections, University of London Press, 1962.
1       REAL PLIM1(2), PLIM2(2), PLIM3(2), PLIM4(2)
2       DATA PLIM1 /0.0, 0.0/
3       DATA PLIM2 /0.0, 0.0/
4       DATA PLIM3 /0.0, 0.0/
5       DATA PLIM4 /0.0, 0.0/
6       CALL SUPMAP (7, 0., 0., 0., PLIM1, PLIM2, PLIM3, PLIM4, 1, 5, 0, 0,IERR)
      CALL SUPMAP (JPRJ, PLAT, PLON, ROTA, PLIM1, PLIM2, PLIM3, PLIM4,
     +             JLTS, JGRD, IOUT, IDOT, IERR)
--------------------------------------------------------------
 *  **  1.  Open GKS
        2.  Define position on plotter frame
 *  **  3.  Define map projection
 *  **  4.  Choose map limits
 *  **  5.  Choose desired political boundaries
 *      6.  Initialize Areas
 *  **  7.  Initialize Ezmap
 *      8.  Add geographic boundaries (or outlines) to area map
        9.  Draw geographic labels
        10.  Draw points and lines on your map
        11.  Draw desired latitude and longitude lines
 *      12.  Fill desired areas
    **  13.  Draw geographic outlines
 *  **  14.  Call FRAME
 *  **  15.  Close GKS
--------------------------------------------------------------
* Steps needed for maps that have masking or filling.** Steps needed for a simple black-and-white map.
      CALL MPGETC (PNAM, CVAL)
      CALL MPGETI (PNAM, IVAL)
      CALL MPGETR (PNAM, RVAL)
      CALL MPSETC (PNAM, CVAL)
      CALL MPSETI (PNAM, IVAL)
      CALL MPSETR (PNAM, RVAL)
      CALL MAPSAV (INFO)
      CALL MAPRST (INFO)
------------------------------------------------------------
      1.  Open GKS
   *  2.  Define position on plotter frame
   *  3.  Define map projection
   *  4.  Choose map limits
   *  5.  Choose desired political boundaries
      6.  Initialize Areas
   *  7.  Initialize Ezmap
      8.  Add geographic boundaries (or outlines) to area map
      9.  Draw geographic labels
      10.  Draw points and lines on your map
      11.  Draw desired latitude and longitude lines
      12.  Fill desired areas
      13.  Draw geographic outlines
      14.  Call FRAME
      15.  Close GKS
------------------------------------------------------------
* Steps discussed in this section.

1       CALL MAPPOS (0.5, 1.0, 0.0, 0.5)
2       CALL MAPDRW
CALL MAPPOS (XVPL, XVPR, YVPB, YVPT)
Line 1 of the cmppos.f code segment sets the left, right, bottom, and top of the viewport so that it is located in the lower left corner of the plotter frame.
To specify the projection you want, call the MAPROJ routine.
1       CALL MAPPOS (.5125, .73125, .63125, .85)
2       CALL MAPROJ ('OR', 0., 0., 0.)
3       CALL MAPDRW
CALL MAPROJ (JPRJ, PLAT, PLON, ROTA)
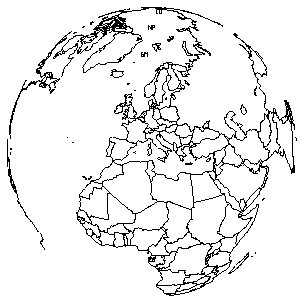
Line 1 of the mpex05.f code segment sets the viewport so that the map is drawn in the upper center of the screen. Line 2 chooses an orthographic projection and centers it on latitude 0 and longitude 0, which is just off the west coast of North Africa. Line 3 draws the map projection.
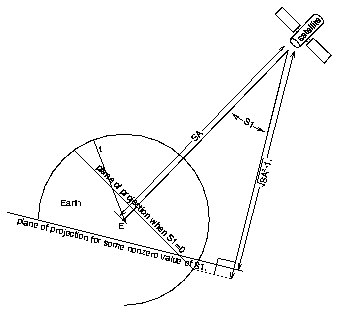
1       CALL MAPROJ ('SV', 40., 10., 0.)
2       CALL MPSETR ('SA - SATELLITE VIEW DISTANCE', 2.)
3       CALL MPSETR ('S1 - SATELLITE ANGLE 1', 10.)
4       CALL MPSETR ('S2 - SATELLITE ANGLE 2', 15.)
5       CALL MAPDRW
      CALL MPSETR ('SA', sa)
      CALL MPSETR ('S1', s1)
      CALL MPSETR ('S2', s2)
If the basic satellite view is desired, it is not necessary for the user to set either S1 or S2. However, to get a satellite view instead of an orthographic projection, it is necessary to set SA>1.0.
Line 1 of the cmpsat.f code segment sets up the projection to give us a reasonably undistorted view of the Mediterranean. Line 2 sets the satellite at two earth radii distant (roughly 4000 miles out). Lines 3 and 4 set the viewing angle to be slightly off of straight down, and line 5 draws our map.
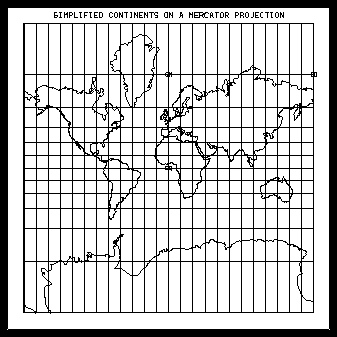
1       DATA PLIM1 /30., 0./
2       DATA PLIM2 /-15., 0./
3       DATA PLIM3 /60., 0./
4       DATA PLIM4 /30., 0./
5       CALL MPSETC ('OU - OUTLINE DATA FLAG', 'PO')
6       CALL MAPROJ ('ME', 0., 0., 0.)
7       CALL MAPSET ('CO', PLIM1, PLIM2, PLIM3, PLIM4)
8       CALL MAPINT
9       CALL MAPLOT
CALL MPSETC ('OU', string)
Although state outlines for the US are available, major geographic features like rivers and mountains, and political features like the provinces in other countries are not available with NCAR Graphics at this time. We hope to incorporate this information into one of the future releases of the software.
Figure 1 Figure 2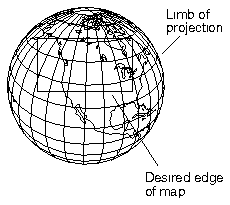
Figure 3
1       DATA PLIM1 /30., 0./
2       DATA PLIM2 /-15., 0./
3       DATA PLIM3 /60., 0./
4       DATA PLIM4 /30., 0./
5       CALL MAPROJ ('ME', 0., 0., 0.)
6       CALL MAPSET ('CO', PLIM1, PLIM2, PLIM3, PLIM4)
7       CALL MAPINT
8       CALL MAPLOT
CALL MAPSET (JLIM, PLIM1, PLIM2, PLIM3, PLIM4)
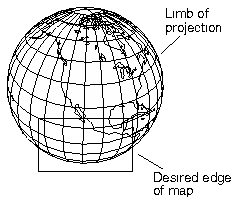
In Figure 1 of the cmpou example, JLIM can be set to CO, PO, or LI. However, CO won't work in Figure 2 because one of the necessary corners of specification is outside the projected map area. In Figure 3, only LI works as an option because both a necessary corner and the entire side of the desired map is outside the limb of projection.
Note: Most compilers allow us to treat PLIM1 through PLIM4 as if they were reals, so we can pass in reals in the code when JLIM=MA, CO, LI, or AN.
1       CALL COLOR
2       CALL MPSETC ('OU - OUTLINE DATA FLAG', 'PS')
3       CALL MPSETI ('C1 - COLOR INDEX 1 - PERIMETER', 1)
4       CALL MPSETI ('C2 - COLOR INDEX 2 - GRID', 2)
5       CALL MPSETI ('C3 - COLOR INDEX 3 - LABELS', 3)
6       CALL MPSETI ('C4 - COLOR INDEX 4 - LIMB LINE', 4)
7       CALL MPSETI ('C5 - COLOR INDEX 5 - CONTINENTAL OUTLINES', 5)
8       CALL MPSETI ('C6 - COLOR INDEX 6 - US STATE OUTLINES', 6)
9       CALL MPSETI ('C7 - COLOR INDEX 7 - COUNTRY OUTLINES', 7)
10      CALL MAPROJ ('SV', 40., -50., 0.)
11      CALL MPSETR ('SA - SATELLITE VIEW DISTANCE', 5.)
12      CALL MAPSET ('MA', PLIM1, PLIM2, PLIM3, PLIM4)
13      CALL MAPINT
      CALL MPSETI ('C1', ic1)
      CALL MPSETI ('C2', ic2)
      CALL MPSETI ('C3', ic3)
      CALL MPSETI ('C4', ic4)
      CALL MPSETI ('C5', ic5)
      CALL MPSETI ('C6', ic6)
      CALL MPSETI ('C7', ic7)
--------------------------------
Parameter  Type     Area of
                    effect
--------------------------------
C1         Integer  Perimeter
C2         Integer  Grid (lat/
                    lon lines)
C3         Integer  Labels
C4         Integer  Limb line
C5         Integer  Continental
                    outlines
C6         Integer  US state
                    outlines
C7         Integer  Country
                    outlines
--------------------------------
If you wanted to make the entire map the same color, you could set the polyline and text colors using the GKS calls GSPLCI and GSTXCI, and not set Ezmap parameters C1 through C7.

1       CALL MAPROJ ('SV', 40., 10., 0.)
2       CALL MPSETR ('SA - SATELLITE VIEW DISTANCE', 5.)
3       CALL MPSETC ('OU - OUTLINE DATA FLAG', 'PO')
4       CALL MAPDRW
5
6       SUBROUTINE MAPUSR (IPRT)
7 C 1110000011100000
8       IF (IPRT .EQ. 1) CALL DASHDB (57568)
9 C 1111111100000000
10      IF (IPRT .EQ. 2) CALL DASHDB (65280)
11C 0100110001110000
12      IF (IPRT .EQ. 4) CALL DASHDB (19568)
13C 1111000011110000
14      IF (IPRT .EQ. 5) CALL DASHDB (61680)
15C 1110010011100100
16      IF (IPRT .EQ. 6) CALL DASHDB (58596)
17C 010101010101010101
18      IF (IPRT .EQ. 7) CALL DASHDB (21845)
19      RETURN
20      END
SUBROUTINE MAPUSR (IPRT)
Because characters are drawn using the GKS routine GTX, not the Dashline utility, do not attempt to set a dashed line for them in MAPUSR.
This version of MAPUSR uses the dash pattern option to draw the various parts of the map. However, if you set the dotted outline flag DO nonzero to specify dotted outlines, this version of MAPUSR would have no effect.
1       SUBROUTINE MAPEOD (NOUT, NSEG, IDLS, IDRS, NPTS, PNTS)
2       DIMENSION PNTS (*)
3       IF (IDLS .NE. 2 .AND. IDRS .NE. 2) NPTS=0
4       IF (IDLS .NE. 1 .AND. IDRS .NE. 1 .AND.
       + IDLS .NE. 3 .AND. IDRS .NE. 3 .AND.
       + IDLS .NE. 11 .AND. IDRS .NE. 11 .AND.
       + IDLS .NE. 79 .AND. IDRS .NE. 79 .AND.
       + IDLS .NE. 99 .AND. IDRS .NE. 99 .AND.
       + IDLS .NE. 104 .AND. IDRS .NE. 104 .AND.
       + IDLS .NE. 107 .AND. IDRS .NE. 107 .AND.
       + IDLS .NE. 163 .AND. IDRS .NE. 163)      NPTS=0
5       RETURN
6       END
CALL MAPEOD (NOUT, NSEG, IDLS, IDRS, NPTS, PNTS)
----------------------------------------
Number  Name  Contents
----------------------------------------
1       CO    Continental outlines only
2       US    US state outlines only
3       PS    Continental, US state,
              and international outlines
4       PO    Continental and interna
              tional outlines
----------------------------------------
MAPEOD is called by Ezmap to examine each segment in an outline dataset just before it is plotted. The default version does nothing. The mpex03, mpex05, and mpex09 examples all contain versions of MAPEOD that you might find useful.
1       CALL MAPROJ ('SV', 40., 10., 0.)
2       CALL MPSETR ('SA - SATELLITE VIEW DISTANCE', 5.)
3       CALL MPSETC ('OU - OUTLINE DATA FLAG', 'PO')
4       CALL MPSETI ('PE - PERIMETER FLAG', 0)
5       CALL MPSETI ('EL - ELLIPTICAL PERIMETER FLAG', 1)
      CALL MPSETI ('PE', ipe)
      CALL MPSETI ('EL', iel)
An "ellipse" is a particular kind of closed curve as defined by any plane geometry text.
A "limb line" is that line in the Ezmap projection plane separating points into which some point on the globe projects from points into which no point on the globe projects. For example, when you are using an orthographic projection, the visible side of the globe maps into the interior of a circle of radius 1 and centered at the origin; the "limb" of an orthographic projection is therefore that circle. Depending on the projection being used, the "limb lines" may be straight lines, circles, ellipses, parabolas, or hyperbolas. Limb lines can also be complicated curves (sometimes defined by means of a function and sometimes defined by means of a table of X/Y coordinates defining a polygon) for projections not offered by Ezmap.
Lines 1 through 3 of the cmpel.f code segment set up the satellite map projection. Lines 4 and 5 turn off perimeter drawing. Examine the plot to see the places where Ezmap has not drawn a dividing line between a geographical outline and the background; this occurs because PE has been turned off.
      CALL MAPRS
      CALL MAPSAV (IUNIT)
      CALL MAPRST (IUNIT)
You need fewer steps to produce simple black-and-white maps than you do when you use the Areas utility for maps that require masking and filling.
-----------------------------------------------
   1.  Open GKS
   2.  Define position on plotter frame
   3.  Define map projection
   4.  Choose map limits
   5.  Choose desired political boundaries
   6.  Initialize Ezmap
   7.  Draw geographic labels
   8.  Draw points and lines on your map
   9.  Draw desired latitude and longitude lines
   10.  Draw geographic outlines
   11.  Call FRAME
   12.  Close GKS
-----------------------------------------------
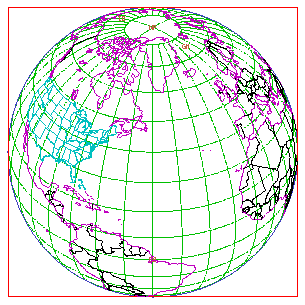
1       CALL COLOR
2       CALL MPSETC ('OU - OUTLINE DATA FLAG', 'PO')
3       CALL MAPROJ ('SV', 40., -50., 0.)
4       CALL MPSETR ('SA - SATELLITE VIEW DISTANCE', 5.)
5       CALL MAPSET ('MA', PLIM1, PLIM2, PLIM3, PLIM4)
6       CALL MAPINT
CALL MAPINT
You must call MAPINT to initialize the Ezmap utility after calling MAPPOS, MAPROJ, or MAPSET.
Currently, it is okay to call MAPINT many times. You can check the flag IN (which may be retrieved by a call to MPGETI) to determine whether or not a call to MAPINT is required at a given time. You can change internal parameters such as C1, OU, LA, and so on either before or after a call to MAPINT, but for consistency with Conpack, we set Ezmap parameters before initialization.

1       CALL COLOR
2       CALL MPSETC ('OU - OUTLINE DATA FLAG', 'PO')
3       CALL MPSETI ('C2 - COLOR INDEX 2 - GRID', 2)
4       CALL MPSETI ('C4 - COLOR INDEX 4 - LIMB LINE', 2)
5       CALL MAPROJ ('SV', 40., -50., 0.)
6       CALL MPSETR ('SA - SATELLITE VIEW DISTANCE', 5.)
7       CALL MAPSET ('MA', PLIM1, PLIM2, PLIM3, PLIM4)
8       CALL MPSETR ('GR - GRID SPACING', 10.)
9       CALL MPSETR ('GD - GRID DRAWING RESOLUTION', 10.)
10      CALL MAPINT
11      CALL MAPGRD
      CALL MPSETR ('GR', gr)
      CALL MPSETR ('GD', gd)
      CALL MAPGRD
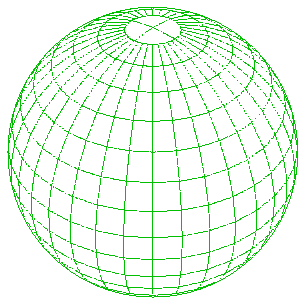
Line 8 sets the grid lines to be drawn at intervals of 10 degrees. Line 9 sets the accuracy parameter to 10 so that the map requires a minimum of CPU and plotting time.
GD sets the distance between points on each latitude and longitude curve. By setting GD=10 degrees, we are setting the grid lines so that they may not be extremely accurate between calculated points. However, the first exercise below shows that the resulting difference in the curves is reasonably small (knowing that CPU time and CGM size both increase rapidly as GD gets smaller). Line 10 initializes Ezmap, and line 11 draws the grid lines and the limb line (the line around the globe).
If you plan to use idt to zoom in on an area one degree across, then you may want to draw the grid lines using points that are closer together on the globe; this increases the accuracy with which those lines are projected on the map.
1       CALL MPSETR ('GR - GRID SPACING', 10.)
2       CALL MPSETR ('GD - GRID DRAWING RESOLUTION', 10.)
3       CALL MPSETI ('DA - GRID DASHLINE PATTERN', 64764)
4       CALL MAPINT
5       CALL MAPGRD
CALL MPSETI ('DA', ida)
(- - -   - - -   )
(---  ---  )
1       CALL COLOR
2       CALL MPSETC ('OU - OUTLINE DATA FLAG', 'PO')
3       CALL MPSETI ('C2 - COLOR INDEX 2 - GRID', 2)
4       CALL MPSETI ('C4 - COLOR INDEX 4 - LIMB LINE', 2)
5       CALL MPSETI ('C1 - COLOR INDEX 1 - PERIMETER', 1)
6       CALL MPSETI ('C3 - COLOR INDEX 3 - LABELS', 1)
7       CALL MAPROJ ('SV', 40., -50., 0.)
8       CALL MPSETR ('SA - SATELLITE VIEW DISTANCE', 5.)
9       CALL MAPSET ('MA', PLIM1, PLIM2, PLIM3, PLIM4)
10      CALL MPSETI ('LA - MERIDIAN/POLE LABEL FLAG', 1)
11      CALL MPSETI ('LS - LABEL SIZE', 40)
12      CALL MAPINT
13      CALL MAPGRD
14      CALL MAPLBL
      CALL MPSETI ('LA', ila)
      CALL MPSETI ('LS', ils)
      CALL MAPLBL
Line 10 ensures that labels are drawn, and line 11 sets labels to be about 0.040 NDCs in size. Line 12 initializes Ezmap, line 13 draws the grid and limb lines, and line 14 draws the label and perimeter.
If LA is turned off, MAPLBL won't draw any labels. MAPLBL is also responsible for drawing the perimeter, if desired (when PE<>0). The cmplbl example uses white to show things drawn by MAPLBL, and green to show things drawn by MAPGRD.
1       CALL COLOR
2       CALL MPSETC ('OU - OUTLINE DATA FLAG', 'PO')
3       CALL MPSETI ('C5 - COLOR INDEX 5 - CONTINENTAL OUTLINES', 5)
4       CALL MPSETI ('C7 - COLOR INDEX 7 - COUNTRY OUTLINES', 5)
5       CALL MPSETI ('C2 - COLOR INDEX 2 - GRID', 2)
6       CALL MPSETI ('C4 - COLOR INDEX 4 - LIMB LINE', 2)
7       CALL MPSETI ('C1 - COLOR INDEX 1 - PERIMETER', 1)
8       CALL MPSETI ('C3 - COLOR INDEX 3 - LABELS', 1)
9       CALL MAPROJ ('SV', 40., -50., 0.)
10      CALL MPSETR ('SA - SATELLITE VIEW DISTANCE', 5.)
11      CALL MAPSET ('MA', PLIM1, PLIM2, PLIM3, PLIM4)
12      CALL MPSETI ('DO - DOTTED OUTLINE FLAG', 1)
13      CALL MPSETI ('DD - DISTANCE BETWEEN DOTS', 7)
14      CALL MAPINT
15      CALL MAPGRD
16      CALL MAPLBL
17      CALL MAPLOT
      CALL MPSETI ('DO', ido)
      CALL MPSETI ('DD', idd)
      CALL MAPLOT
Line 12 turns on dotted line drawing of political and continental outlines, and line 13 spaces these outline dots closer together than the dots that form the grid lines. Line 14 initializes Ezmap, and line 15 draws the grid and limb lines. Line 16 draws the labels and perimeter, and line 17 draws the magenta outlines.
By default, continental outlines are drawn using solid lines from the Dashline utility. If you set DO nonzero, the continental outlines drawn as dots by Ezmap; Dashline is not used. DD controls the distance between dots.
Note: Most users don't need the RE parameter.

1       CALL COLOR
2       CALL MPSETC ('OU - OUTLINE DATA FLAG', 'PO')
3       CALL MPSETI ('C5 - COLOR INDEX 5 - CONTINENTAL OUTLINES', 5)
4       CALL MPSETI ('C7 - COLOR INDEX 7 - COUNTRY OUTLINES', 5)
5       CALL MPSETI ('C2 - COLOR INDEX 2 - GRID', 2)
6       CALL MPSETI ('C4 - COLOR INDEX 4 - LIMB LINE', 2)
7       CALL MPSETI ('C1 - COLOR INDEX 1 - PERIMETER', 1)
8       CALL MPSETI ('C3 - COLOR INDEX 3 - LABELS', 1)
9       CALL MAPROJ ('SV', 40., -50., 0.)
10      CALL MPSETR ('SA - SATELLITE VIEW DISTANCE', 5.)
11      CALL MAPSET ('MA', PLIM1, PLIM2, PLIM3, PLIM4)
12      CALL MPSETR ('GR - GRID SPACING', 10.)
13      CALL MPSETR ('GD - GRID DRAWING RESOLUTION', 10.)
14      CALL MPSETI ('LA - MERIDIAN/POLE LABEL FLAG', 1)
15      CALL MPSETI ('LS - LABEL SIZE', 40)
16      CALL MPSETI ('DO - DOTTED OUTLINE FLAG', 1)
17      CALL MPSETI ('DD - DISTANCE BETWEEN DOTS', 7)
18      CALL MAPDRW
CALL MAPDRW
Lines 12 and 13 of the cmpdrw.f code segment set grid parameters discussed in module "Mp 3.2 Grids: Drawing latitude and longitude lines." Lines 14 and 15 set label parameters discussed in the preceding module. Line 16 turns on dotted line drawing of political and continental outlines, and line 17 sets the dots closer together than gridline dots.
The shortcut occurs as line 18 calls MAPDRW. Notice that since MAPDRW calls MAPINT, calls to MAPROJ, MAPSET, and MAPPOS must be made before calling MAPDRW. Also, since MAPDRW calls MAPINT, MAPGRD, MAPLBL, and MAPLOT, parameters that affect those routines must be set before calling MAPDRW.
You can probably use MAPDRW in almost any simple map drawing. However, as shown in Ezmap section "Mp 4. Producing maps with masking or filled areas," it is often desirable to be able to call MAPINT and MAPLOT separately.
----------------------------------------------------------
    1.  Open GKS
    2.  Define position on plotter frame
    3.  Define map projection
    4.  Choose map limits
    5.  Choose desired political boundaries
 *  6.  Initialize Areas
 *  7.  Initialize Ezmap
 *  8.  Add geographic boundaries (or outlines) to area map
 *  9.  Draw geographic labels
    10.  Draw points and lines on your map
 *  11.  Draw desired latitude and longitude lines
 *  12.  Fill desired areas
    13.  Draw geographic outlines
    14.  Call FRAME
    15.  Close GKS
----------------------------------------------------------
* Steps discussed in this section.
1       SUBROUTINE MASK (XC, YC, MCS, AREAID, GRPID, IDSIZE)
2
3       INTEGER AREAID(IDSIZE), GRPID(IDSIZE), ID
4       REAL XC(MCS), YC(MCS)
5       DO 10, I=1, IDSIZE
6          IF (GRPID(I) .EQ. 1) ID = AREAID(I)
7   10  CONTINUE
8       IF ((MAPACI(ID) .EQ. 1) .AND. (MCS .GE. 2)) THEN
9          CALL CURVED (XC, YC, MCS)
10      ENDIF
11      RETURN
12      END
MAPACI (IDAREA)
The second column contains the area identifier for the area so you can uniquely address any area in the map database. The third column shows the suggested color index for the area. These color indices are carefully chosen so that no country or state has the same color as any of its neighbors. Also note that all bodies of water like oceans and lakes have a color index of 1. This makes it easy for your program to pick out the oceans for masking purposes or to choose an appropriate color for the oceans.
In line 8 of the cmpmsk.f code segment, note that MAPACI is called as a function rather than as a subroutine. MAPACI returns an integer value that can be used to detect ocean or land masses, to set color-fill values, and for many other purposes. A complete discussion of this code segment appears in module "Mp 4.6 Grid lines with masking: Writing a masking routine."
1       CALL MPSETI ('VS - VERTICAL STRIPS', 9)
2       CALL MPSETC ('OU - OUTLINE DATA FLAG', OUTLN)
3       CALL MPSETR ('GR - GRID SPACING', GRD)
4       CALL MAPROJ (PROJ, PLAT, PLON, ROTA)
5       IF (PROJ .EQ. 'SV') CALL MPSETR ('SA - SATELLITE VIEW DISTANCE', 5.)
6       CALL MAPSET (JLIM, PLIM1, PLIM2, PLIM3, PLIM4)
7       CALL MAPINT
      CALL MPSETI ('VS', ivs)
      CALL MPSETI ('G1', ig1)
      CALL MPSETI ('G2', ig2)
The cmpgrp.f code segment creates a plot using nine vertical strips; this has the effect of making the areas created both smaller and simpler. Line 1 sets the number of vertical strips by giving VS the value of 9. Lines 2 through 9 then set up map drawing normally.

1       EXTERNAL MASK
2       CALL MAPINT
3       CALL ARINAM (MAP, LMAP)
4       CALL MAPBLA (MAP)
5       CALL MAPGRM (MAP, XWRK, YWRK, NWRK, IAREA, IGRP, ISIZ, MASK)
      CALL MAPINT
      CALL ARINAM (MAP, LMAP)
      CALL MAPBLA (MAP)
Although MAPINT and ARINAM have been discussed previously, they are included in the synopsis because both routines are critical to using Ezmap with Areas. As shown before, MAPINT sets up the map limits and projection, defining a set of lines that divide up the plane. ARINAM initializes the area map array. MAPBLA takes the lines defined by MAPINT and adds them to the area map, using the default of edge group 1 for geographical map outlines and the default of edge group 2 for creating a set of vertical strips. Please see the previous module for further information on setting and using Ezmap group identifiers and vertical strips.
If you set the area map too small, the error message:
ERROR 5 IN AREDAM - AREA-MAP ARRAY OVERFLOWoccurs when MAPBLA is called. There is no good way to predict exactly how large the area map should be before adding edges to it. Try setting LMAP=50000 and increasing it as necessary. It is not unusual to need LMAP=250000 in maps with lots of tiny regions.

1       EXTERNAL MASK
2       CALL MPSETI ('LS - LABEL SIZE', 20)
3       CALL MAPINT
4       CALL ARINAM (MAP, LMAP)
5       CALL MAPBLA (MAP)
6       CALL MAPGRM (MAP, XWRK, YWRK, NWRK, IAREA, IGRP, ISIZ, MASK)
7       CALL MPSETI ('EL - ELLIPTICAL PERIMETER FLAG', 1)
8       CALL MAPLBL
9       CALL MAPLOT
      CALL MAPLBL
      CALL MPSETI ('LA', ila)
      CALL MPSETI ('LS', ils)
If LA is turned off, MAPLBL does not draw any labels. MAPLBL also draws the perimeter if one is specified. The perimeter parameter PE<>0 by default.
1       EXTERNAL MASK
2       CALL MAPINT
3       CALL ARINAM (MAP, LMAP)
4       CALL MAPBLA (MAP)
5       CALL MAPGRM (MAP, XWRK, YWRK, NWRK, IAREA, IGRP, ISIZ, MASK)
6       CALL MAPLBL
7       CALL MAPLOT
CALL MAPGRM (MAP, XCS, YCS, MCS, IAREA, IGRP, ISIZ, LPR)
ISIZ, the size of the group and area identifier arrays (IAREA and IGRP), is determined by how many groups of lines you have added to the area map. Remember that the first group is the geographical outline set. Other groups might include vertical stripping if you are using it, contour lines, or lines that you may want to add to the area map using the Ezmap line-drawing routines.
Lines 6 and 7 label the globe and draw continental outlines.
1       SUBROUTINE MASK (XC, YC, MCS, AREAID, GRPID, IDSIZE)
2       INTEGER AREAID(IDSIZE), GRPID(IDSIZE), ID
3       REAL XC(MCS), YC(MCS)
4       DO 10, I=1, IDSIZE
5          IF (GRPID(I) .EQ. 1) ID = AREAID(I)
6   10  CONTINUE
7       IF ((MAPACI(ID) .EQ. 1) .AND. (MCS .GE. 2)) THEN
8          CALL CURVED (XC, YC, MCS)
9       ENDIF
10      RETURN
11      END
      SUBROUTINE LPR (XCS, YCS, NCS, IAREA, IGRP, ISIZ)
      DIMENSION XCS(*), YCS(*), IAREA(*), IGRP(*)
 SUBROUTINE LPR (XCS, YCS, NCS,
+ IAREA, IGRP, ISIZ)
 DIMENSION XCS(*), YCS(*), IAREA(*),
+ IGRP(*)
RETURN
END
CALL SET (VPL, VPR, VPB, VPT, VPL, VPR, VPB, VPT, 1)
By using the color identifier to pick out land values, you could draw grid lines only over land. Similarly, by looking up the area identifiers for a given country in section "Mp 6. Table of Ezmap area identifiers," you could draw grid lines either only over a given country, or over everything except a given country.

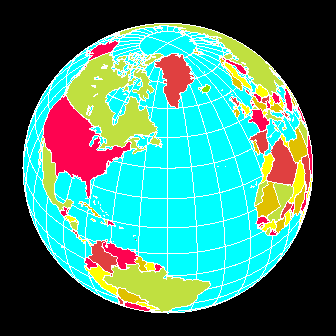
1       CALL COLOR
2       CALL MAPINT
3       CALL ARINAM (MAP, LMAP)
4       CALL MAPBLA (MAP)
5       CALL GSFAIS (1)
6       CALL ARSCAM (MAP, XWRK, YWRK, NWRK, IAREA, IGRP, ISIZ, FILL)
7       CALL MAPGRM (MAP, XWRK, YWRK, NWRK, IAREA, IGRP, ISIZ, MASK)
8       CALL MAPLOT
CALL ARSCAM (MAP, XWRK, YWRK, NWRK, IAREA, IGRP, ISIZ, FILL)
Line 5 sets the GKS interior fill style to "solid" to produce solid fill. Line 6 calls the Areas scan area map routine with user-supplied fill routine so that each country is filled. Line 7 draws the grid lines over water, and line 8 draws the continental and political boundaries. The order of the overlaying done by these calls is critical to produce proper results. You must call detail-drawing routines after filling, since color-fill draws over anything that might have been there previously.
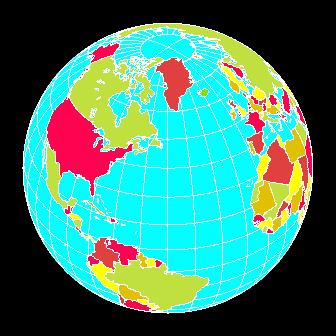
1       SUBROUTINE FILL (XWRK, YWRK, NWRK, IAREA, IGRP, IDSIZ)
2       DIMENSION XWRK(*), YWRK(*), IAREA(*), IGRP(*)
3       ID=0
4       DO 10, I=1, IDSIZ
5              IF (IGRP(I) .EQ. 1) ID = IAREA(I)
6   10  CONTINUE
7       IF (ID .GE. 1) THEN
8              CALL GSFACI (MAPACI(ID) + 1)
9              CALL GFA (NWRK, XWRK, YWRK)
10      ENDIF
11      RETURN
12      END
      SUBROUTINE FILL (XWRK, YWRK, NWRK, IAREA, IGRP, NGRPS)
      DIMENSION XWRK(*), YWRK(*), IAREA(*), IGRP(*)
      SUBROUTINE FILL (XWRK, YWRK, NWRK, IAREA, IGRP, NGRPS)
      DIMENSION XWRK(*), YWRK(*), IAREA(*), IGRP(*)
      RETURN
      END
Lines 4 through 6 of the cmpfil.f code segment retrieve the area identifier for the geographic region by checking each element of the group array for group identifier 1, and assigning its associated area id to ID. Line 7 checks to see if the area is over the map, and if so, line 8 chooses a color index by retrieving the suggested Ezmap color using MAPACI. Line 9 fills the area.
----------------------------------------------------------
    1.  Open GKS
    2.  Define position on plotter frame
    3.  Define map projection
    4.  Choose map limits
    5.  Choose desired political boundaries
    6.  Initialize Areas
    7.  Initialize Ezmap
    8.  Add geographic boundaries (or outlines) to area map
    9.  Draw geographic labels
 *  10.  Draw points and lines on your map
    11.  Draw desired latitude and longitude lines
    12.  Fill desired areas
    13.  Draw geographic outlines
    14.  Call FRAME
    15.  Close GKS
----------------------------------------------------------
* Steps discussed in this section.
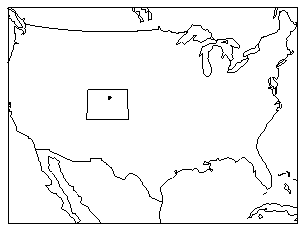
1       CALL MAPDRW
3       CALL MAPTRA (40., -105.15, X, Y)
4       IF (X .NE. 1.E12) CALL POINTS (X, Y, 1, -3, 0)
CALL MAPTRA (RLAT, RLON, UVAL, VVAL)
If the point is not projectable on the map, both routines return UVAL equal to 1.E12.
Line 1 of the cmptra.f code segment draws the map as a reminder that the map projection and limits have been set up and that the map has been drawn. Line 3 calls MAPTRA to get the user coordinates of the point. If the coordinates are on the projection, then an asterisk is drawn over Boulder, Colorado, USA. MAPTRN or MAPTRA can be called any time after MAPINT is called.
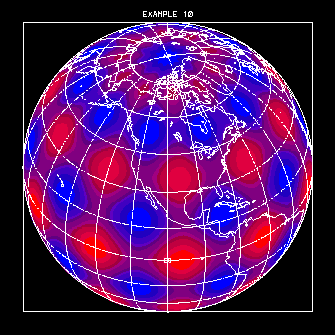
1        DO 103, I=1, NCLS
2          X = CFUX (.05 + .90 * (REAL (I-1) + .5) / REAL (NCLS))
3          DO 102, J=1, NCLS
4            Y = CFUY (.05 + .90 * (REAL (J-1) + .5) / REAL (NCLS))
5            CALL MAPTRI (X, Y, RLAT, RLON)
6            IF (RLAT .NE. 1.E12) THEN
7                DVAL = .25 * (1. + COS (DTOR * 10. * RLAT)) +
        +         .25 * (1. + SIN (DTOR * 10. * RLON)) * COS (DTOR * RLAT)
8                ICRA (I,J) = MAX (2, MIN (NCLR+1, 2+INT (DVAL * REAL (NCLR))))
9            ELSE
10               ICRA (I,J) = 0
11           ENDIF
12 102     CONTINUE
13 103   CONTINUE
14       CALL GCA (CFUX(.05), CFUY(.05), CFUX(.95), CFUY(.95), 1000, 1000,
        + 1, 1, NCLS, NCLS, ICRA)
15       CALL MAPDRW
CALL MAPTRI (X, Y, RLAT, RLON)
Lines 1 through 13 of the mpex10.f code segment pick values to fill a cell array that will be used to color the globe. In line 2, CFUX takes an X coordinate in NDCs and returns an X coordinate in user coordinates. Similarly, CFUY in line 4 takes a Y coordinate of a point in NDCs and returns a Y value in user coordinates.
Line 5 uses MAPTRI to retrieve the coordinates of the point in latitude and longitude. Since MAPTRI returns a value of RLAT=1.E12 if the point is not over a plotted portion of the globe, line 6 checks to see if the point maps onto the portion of the globe that will be plotted. If it does, then a value for the cell array is specified there. Otherwise, line 10 sets the cell array element to black. Line 14 fills the cell array, and line 15 draws the map over it.

1       CALL MAPDRW
2       CALL MAPIT (37., -109., 0)
3       CALL MAPIT (41., -109., 1)
4       CALL MAPIT (41., -102., 1)
5       CALL MAPIT (37., -102., 1)
6       CALL MAPIT (37., -109., 1)
7       CALL MAPIQ
      CALL MAPIT (RLAT, RLON, IFST)
      CALL MAPIQ
The Ezmap parameter DL determines whether MAPIT draws solid lines or dotted lines. Dotted lines are drawn using calls to POINTS. Solid lines are drawn using calls to DASHD, FRSTD, and VECTD. The parameters DD and MV also affect the behavior of MAPIT. For more information on these parameters, see the descriptions in module "Mp 3.5 Drawing political and geographic outlines."
A sequence of calls to MAPIT should be followed by a call to MAPIQ to flush its buffers before a STOP, a CALL FRAME, or a call to change the color index. Points in two contiguous pen-down calls to MAPIT should not be far apart on the globe.
It doesn't matter whether you call MAPIT and MAPIQ before or after calling the map-drawing routines. However, MAPIT and MAPIQ must be called after Ezmap is initialized. In line 1 of the cmptra.f code segment, the call to MAPDRW initializes Ezmap.
Line 2 tells MAPIT to start drawing at the lower left corner of Colorado. Lines 3 through 6 draw the four sides of the state, and line 7 quits drawing.
Another application of MAPIT appears in the next module.
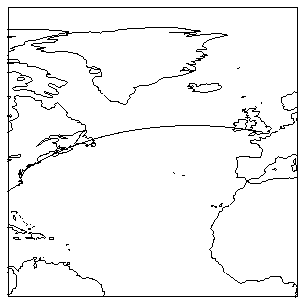
1       CALL SUPMAP (8, 0., -50., 0., 0., -80., 90., 10., 2, 0., 0, 0, IERR)
2       CALL MAPGCI (38., -77., 51., 0., 100, RLAT, RLON)
3       CALL MAPIT (38., -77., 0)
4       DO 10, I=1, 100
5              CALL MAPIT (RLAT(I), RLON(I), 1)
6   10  CONTINUE
7       CALL MAPIT (51., 0., 1)
8       CALL MAPIQ
CALL MAPGCI (ALAT, ALON, BLAT, BLON, NOPI, RLTI, RLNI)

1       EXTERNAL FILL
2       COMMON /DAT1/ ZDAT(M,N)
3       CALL ARINAM (MAP, IMAP)
4       CALL MAPINT
5       CALL MAPBLA (MAP)
6       DO 1, I = -90, 90, IGRD
7          DO 2, J = -180, 180 - IGRD, IGRD
8             LEFT = (J + 181) * 1000 + (I + 91)
9             CALL MAPITA (REAL(I), REAL(J),      0, MAP, 5, LEFT, 0)
10            CALL MAPITA (REAL(I), REAL(J+IGRD), 1, MAP, 5, LEFT, 0)
11            CALL MAPIQA (MAP, 5, LEFT, 0)
12   2     CONTINUE
13   1  CONTINUE
14      DO 3, I = -180, 180, IGRD
15         DO 4, J = -90, 90 - IGRD, IGRD
16            CALL MAPITA (REAL(J),      REAL(I), 0, MAP, 5, 0, 0)
17            CALL MAPITA (REAL(J+IGRD), REAL(I), 1, MAP, 5, 0, 0)
18            CALL MAPIQA (MAP, 5, 0, 0)
19   4     CONTINUE
20   3  CONTINUE
21      CALL GSFAIS(1)
22      CALL ARSCAM (MAP, XWRK, YWRK, NWRK, IAREA, IGRP, 5, FILL)
      CALL MAPITA (RLAT, RLON, IFST, MAP, IDGRP, IDLEFT, IDRIT)
      CALL MAPIQA (MAP, IDGRP, IDLEFT, IDRIT)
Area identifiers used for an entire curve are not necessarily the ones used for each call to MAPITA or MAPIQA. Inside the two routines is a 100-point buffer. Whenever the buffer fills or MAPIQA is called, the buffer is dumped, and the current values of IDGRP, IDLEFT, and IDRIT are used. To set group and area identifiers, make sure to call MAPIQA after every call to MAPITA where you change group or area identifiers.
Lines 14 through 20 add the longitude lines to the area map, giving each area identifiers of zero. The effect of these four loops is to give each 15-degree square on the map a single nonzero area identifier. When the area map is processed, each 15-degree square is then assigned its only nonzero area identifier. This is a shortcut that could possibly leave zeros as area identifiers for squares that run into the limb of a globe projection. Line 21 sets color fill to solid, and each square is filled by calling ARSCAM in line 22.
Ideally, you would want to assign the same area identifier to all four lines that form each boxed area, and it may be necessary to do this with some projections. Line 22 calls ARSCAM to fill each square over land with a color based on a Z data value. The FILL routine is discussed on the next page.

30      SUBROUTINE FILL (XWRK, YWRK, NWRK, IAREA, IGRP, NSIZE)
31      COMMON /DAT1/ ZDAT(M,N)
32
33      IAREA1 = -1
34      IAREA5 = -1
35      IF (NWRK .LE. 3) RETURN
36      DO 10, I=1, NSIZE
37         IF (IGRP(I) .EQ. 1) IAREA1 = IAREA(I)
38         IF (IGRP(I) .EQ. 5) IAREA5 = IAREA(I)
39  10  CONTINUE
40      IF (IAREA1 .GT. 0) THEN
41         IF (MAPACI (IAREA1) .NE. 1 .AND. IAREA5 .GT. 0) THEN
42            LAT = MOD (IAREA5, 1000)
43            I = LAT / IGRD + 1
44            LON = IAREA5 / 1000
45            J = LON / IGRD + 1
46            ICLR = INT (ZDAT (I, J)) + 1
47            CALL GSFACI (ICLR)
48            CALL GFA (NWRK-1, XWRK, YWRK)
49         ENDIF
50      ENDIF
51      RETURN
52      END
Lines 37 and 38 check our group identifiers and retrieve the area identifiers for areas defined by the geographic map and for areas defined by our two-degree grid over the globe. Line 40 checks to see if the area is over the geographic map. Line 41 checks to see if the area is over land (it has a color index not equal to 1), and if it has a nonzero grid area identifier. If the area is over land, then lines 42 and 44 retrieve the latitude and longitude values for the area, and lines 43 and 45 retrieve the Z array indices.
Line 46 sets the color index to be the Z data value plus 1 (since the data ranges between 1 and 15 and we want to use colors 2 through 16 in our color table). You could just as easily use a different function to translate Z data values into color here. Lines 47 through 49 fill the region with the desired color.
Notice how long this program takes to execute. It is much faster to create a cell array and use MAPTRA to overlay it on a globe. For an example of this, see module "Mp 5.2 Inverse transformations."
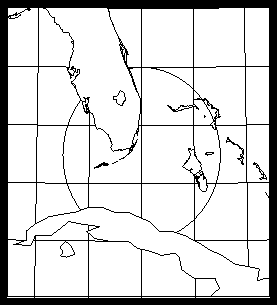
1       EXTERNAL MASK1
2       CALL CMPMSK ('ME', 0., -75., 0., 'PS', 'CO', PLIM1, PLIM2, PLIM3, PLIM4,
       + 2., MAP, LMAP)
3       CALL CIRCLE (25., -80., 3.5, CLAT, CLON, NPTS)
4       CALL MAPITM (CLAT(1), CLON(1), 0, MAP, XWRK, YWRK, NWRK,
       + IAREA, IGRP, NGRPS, MASK1)
5       DO 102, ICIR=2, NPTS
6             CALL MAPITM (CLAT(ICIR), CLON(ICIR), 1, MAP, XWRK, YWRK, NWRK,
       +    IAREA, IGRP, NGRPS, MASK1)
7  102  CONTINUE
8       CALL MAPIQM (MAP, XWRK, YWRK, NWRK, IAREA, IGRP, NGRPS, MASK1)
      CALL MAPITM (RLAT, RLON, IFST, MAP, XWRK, YWRK, NWRK, IAREA, IGRP,
     +             ISIZ, MASK)
      CALL MAPIQM (MAP, XWRK, YWRK, NWRK, IAREA, ISIZ, MASK)
The projection of the line segment joining two points on the globe is considered to be the straight-line segment joining the projections of the points. No attempt is made to project it as if it were a portion of a great circle, so it is a good idea to place points defining each segment closely together.
There are two types of boundaries between visible and invisible regions:
Line 2 of the cmpitm.f code segment calls CMPMSK to draw a map with grid lines masked over land. This code has been slightly modified from the code used in cmpmsk.f. In cmpitm.f, lines 4 through 8 use a single area map both for the grid line masking and for masking the circle that is drawn by using MAPITM and MAPIQM.
Line 3 calls a routine that generates a circle on any part of the globe. Because the globe is not flat, CIRCLE generates a circle of radius RADIUS---3.5 in this case---and rotates that circle to (RLAT, RLON)---25N, 80W in this case. CIRCLE returns CLAT and CLON, two arrays that contain NPTS latitude and longitude coordinates for the desired circle.
In line 4, MAPITM calls MASK1 to determine whether or not to draw the first point in the circle. In lines 5 through 7, MAPITM again calls MASK1 to draw line segments connecting each succeeding point in the circle if those segments are not over land. Line 8 calls MAPIQM to finish the circle.
-----------------------------------------
Number  Name  Contents
-----------------------------------------
1       CO    Continental outlines only
2       US    US state outlines only
3       PS    Continental, US state, and
              international outlines
4       PO    Continental and interna
              tional outlines
-----------------------------------------
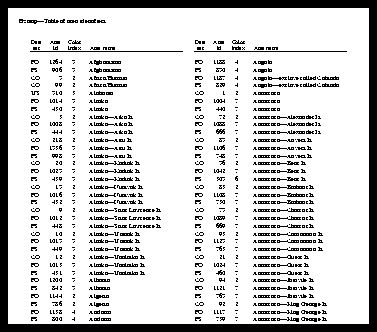
This table shows the association between area identifiers and the names of the areas they identify. The first column gives the outline dataset name, the second column shows an area identifier, the third column shows a suggested color index for the area (to ensure that adjacent areas have different colors), and the name of the area appears in the fourth column.This table is sorted by area name to help you find the area identifiers you need. A copy of this table is also available online via the ncargfile command.
----------------------------------------------
Data Area id Color Area name
set index
----------------------------------------------
PO 1264 3 Afghanistan
PS 906 3 Afghanistan
CO 3 2 Africa/Eurasia
CO 99 2 Africa/Eurasia
US 310 5 Alabama
PO 1014 3 Alaska
PS 450 3 Alaska
CO 5 2 Alaska---Atka Is.
PO 1008 3 Alaska---Atka Is.
PS 444 3 Alaska---Atka Is.
CO 218 2 Alaska---Attu Is.
PO 1356 3 Alaska---Attu Is.
PS 998 3 Alaska---Attu Is.
CO 20 2 Alaska---Kodiak Is.
PO 1023 3 Alaska---Kodiak Is.
PS 459 3 Alaska---Kodiak Is.
CO 13 2 Alaska---Nunivak Is.
PO 1016 3 Alaska---Nunivak Is.
PS 452 3 Alaska---Nunivak Is.
CO 9 2 Alaska---Saint
Lawrence Is.
PO 1012 3 Alaska---Saint
Lawrence Is.
PS 448 3 Alaska---Saint
Lawrence Is.
CO 10 2 Alaska---Umnak Is.
PO 1013 3 Alaska---Umnak Is.
PS 449 3 Alaska---Umnak Is.
CO 12 2 Alaska---Unalaska Is.
PO 1015 3 Alaska---Unalaska Is.
PS 451 3 Alaska---Unalaska Is.
PO 1200 3 Albania
PS 842 3 Albania
PO 1144 2 Algeria
PS 786 2 Algeria
PO 1158 4 Andorra
PS 800 4 Andorra
PO 1188 4 Angola
PS 830 4 Angola
PO 1187 4 Angola---exclave
called Cabinda
PS 829 4 Angola---exclave
called Cabinda
CO 1 2 Antarctica
PO 1004 7 Antarctica
PS 440 7 Antarctica
CO 72 2 Antarctica---Alex
ander Is.
PO 1088 7 Antarctica---Alex
ander Is.
PS 666 7 Antarctica---Alex
ander Is.
CO 83 2 Antarctica---Anvers Is.
PO 1106 7 Antarctica---Anvers Is.
PS 748 7 Antarctica---Anvers Is.
CO 36 2 Antarctica---Bear Is.
PO 1042 7 Antarctica---Bear Is.
PS 503 6 Antarctica---Bear Is.
CO 85 2 Antarctica---Brabant
Is.
PO 1108 7 Antarctica---Brabant
Is.
PS 750 7 Antarctica---Brabant
Is.
CO 73 2 Antarctica---Charcot
Is.
PO 1089 7 Antarctica---Charcot
Is.
PS 669 7 Antarctica---Charcot
Is.
CO 95 2 Antarctica---Corona
tion Is.
PO 1123 7 Antarctica---Corona
tion Is.
PS 765 7 Antarctica---Corona
tion Is.
CO 21 2 Antarctica---Guest Is.
PO 1024 7 Antarctica---Guest Is.
PS 460 7 Antarctica---Guest Is.
CO 94 2 Antarctica---Joinvile
Is.
PO 1121 7 Antarctica---Joinvile
Is.
PS 763 7 Antarctica---Joinvile
Is.
CO 92 2 Antarctica---King
George Is.
PO 1117 7 Antarctica---King
George Is.
PS 759 7 Antarctica---King
George Is.
CO 91 2 Antarctica---Living
ston Is.
PO 1116 7 Antarctica---Living
ston Is.
PS 758 7 Antarctica---Living
ston Is.
CO 14 2 Antarctica---
Roosevelt Is.
PO 1017 7 Antarctica---
Roosevelt Is.
PS 453 7 Antarctica---
Roosevelt Is.
CO 213 2 Antarctica---Ross Is.
PO 1351 7 Antarctica---Ross Is.
PS 993 7 Antarctica---Ross Is.
PO 1098 3 Argentina
PS 713 3 Argentina
PO 1103 3 Argentina---Tierra del
Fuego
PS 739 3 Argentina---Tierra del
Fuego
US 245 2 Arizona
US 270 5 Arkansas
CO 163 2 Australia
PO 1297 3 Australia
PS 939 3 Australia
CO 193 2 Australia---Kangaroo
Is.
PO 1330 3 Australia---Kangaroo
Is.
PS 972 3 Australia---Kangaroo
Is.
CO 185 2 Australia---Melville
and Bathurst Is.
PO 1322 3 Australia---Melville
and Bathurst Is.
PS 964 3 Australia---Melville
and Bathurst Is.
CO 200 2 Australia---Tasmania
PO 1338 3 Australia---Tasmania
PS 980 3 Australia---Tasmania
PO 1178 3 Austria
PS 820 3 Austria
CO 67 2 Bahamas
CO 68 2 Bahamas
CO 70 2 Bahamas
PO 1083 6 Bahamas
PO 1084 6 Bahamas
PO 1086 6 Bahamas
US 360 4 Bahamas---Andros
US 362 4 Bahamas---Andros
US 363 4 Bahamas---Andros
US 365 4 Bahamas---Andros
US 368 4 Bahamas---Andros
US 394 4 Bahamas---Cat Is.
US 372 4 Bahamas---Eleuthera
Is.
US 373 4 Bahamas---Eleuthera
Is.
US 374 4 Bahamas---Eleuthera
Is.
US 359 4 Bahamas---Grand
Bahama
US 366 4 Bahamas---Grand
Bahama
US 367 4 Bahamas---Grand
Bahama
US 364 4 Bahamas---Great
Abaco and Little
Abaco
US 369 4 Bahamas---Mores Is.
US 370 4 Bahamas---New Provi
dence Is.
PO 1276 4 Bangladesh
PS 918 4 Bangladesh
PO 1160 6 Belgium
PS 802 6 Belgium
PO 1064 2 Belize
PS 582 2 Belize
PO 1157 3 Benin
PS 799 3 Benin
PO 1277 3 Bhutan
PS 919 3 Bhutan
CO 203 2 Bismarck Archipel
ago---New Britain
PO 1341 3 Bismarck Archipel
ago---New Britain
PS 983 3 Bismarck Archipel
ago---New Britain
CO 205 2 Bismarck Archipel
ago---New Hanover
PO 1343 3 Bismarck Archipel
ago---New Hanover
PS 985 3 Bismarck Archipel
ago---New Hanover
CO 206 2 Bismarck Archipel
ago---New Ireland
PO 1344 3 Bismarck Archipel
ago---New Ireland
PS 986 3 Bismarck Archipel
ago---New Ireland
CO 123 1 Black Sea
PO 1217 1 Black Sea
PS 859 1 Black Sea
PO 1101 4 Bolivia
PS 734 4 Bolivia
US 223 7 Border
CO 160 2 Borneo
PO 1298 3 Borneo---Brunei
PS 940 3 Borneo---Brunei
PO 1203 6 Botswana
PS 845 6 Botswana
PO 1094 6 Brazil
PS 705 6 Brazil
PO 1211 5 Bulgaria
PS 853 5 Bulgaria
PO 1279 3 Burma
PS 921 3 Burma
PO 1221 4 Burundi
PS 863 4 Burundi
US 226 4 California
US 240 4 California---San Clem
ente Is.
US 234 4 California---San
Miguel Is.(island)
US 239 4 California---San
Nicholas Is.
US 241 4 California---Santa Cat
alina Is.
US 238 4 California---Santa
Cruz Is.
US 235 4 California---Santa
Rosa Is.
PO 1286 2 Cambodia
PS 928 2 Cambodia
PO 1171 3 Cameroon
PS 813 3 Cameroon
PO 1026 6 Canada
PS 462 6 Canada
CO 62 2 Canada---Akimiski Is.
PO 1075 6 Canada---Akimiski Is.
PS 624 6 Canada---Akimiski Is.
CO 82 2 Canada---Anticosti Is.
PO 1105 6 Canada---Anticosti Is.
PS 747 6 Canada---Anticosti Is.
CO 50 2 Canada---Axel
Heiberg Is.
PO 1056 6 Canada---Axel
Heiberg Is.
PS 535 6 Canada---Axel
Heiberg Is.
CO 54 2 Canada---Baffin Is.
PO 1062 6 Canada---Baffin Is.
PS 568 6 Canada---Baffin Is.
CO 25 2 Canada---Banks Is.
PO 1029 6 Canada---Banks Is.
PS 465 6 Canada---Banks Is.
CO 39 2 Canada---Bathurst Is.
PO 1045 6 Canada---Bathurst Is.
PS 509 6 Canada---Bathurst Is.
CO 65 2 Canada---Belcher Is.
PO 1080 6 Canada---Belcher Is.
PS 643 6 Canada---Belcher Is.
CO 33 2 Canada---Borden Is.
PO 1039 6 Canada---Borden Is.
PS 498 6 Canada---Borden Is.
CO 32 2 Canada---Brock Is.
PO 1038 6 Canada---Brock Is.
PS 493 6 Canada---Brock Is.
CO 40 2 Canada---Byam Martin
Is.
PO 1046 6 Canada---Byam Martin
Is.
PS 510 6 Canada---Byam Martin
Is.
CO 63 2 Canada---Bylot Is.
PO 1078 6 Canada---Bylot Is.
PS 634 6 Canada---Bylot Is.
CO 58 2 Canada---Coats Is.
PO 1070 6 Canada---Coats Is.
PS 610 6 Canada---Coats Is.
CO 47 2 Canada---Cornwall Is.
PO 1053 6 Canada---Cornwall Is.
PS 525 6 Canada---Cornwall Is.
CO 48 2 Canada---Cornwallis
Is.
PO 1054 6 Canada---Cornwallis
Is.
PS 528 6 Canada---Cornwallis
Is.
CO 49 2 Canada---Devon Is.
PO 1055 6 Canada---Devon Is.
PS 529 6 Canada---Devon Is.
CO 28 2 Canada---Eglinton Is.
PO 1033 6 Canada---Eglinton Is.
PS 484 6 Canada---Eglinton Is.
CO 37 2 Canada---Ellef
Ringnes and Amund
Ringnes Is.
PO 1043 6 Canada---Ellef
Ringnes and Amund
Ringnes Is.
PS 507 6 Canada---Ellef
Ringnes and Amund
Ringnes Is.
CO 53 2 Canada---Ellesmere Is.
PO 1060 6 Canada---Ellesmere Is.
PS 562 6 Canada---Ellesmere Is.
CO 26 1 Canada---Great Bear
Lake
PO 1030 1 Canada---Great Bear
Lake
PS 466 1 Canada---Great Bear
Lake
CO 31 1 Canada---Great Slave
Lake
PO 1036 1 Canada---Great Slave
Lake
PS 490 1 Canada---Great Slave
Lake
PS 716 1 Canada---lake
US 415 1 Canada---lake
CO 35 1 Canada---Lake Atha
basca
PO 1041 1 Canada---Lake Atha
basca
PS 501 1 Canada---Lake Atha
basca
CO 44 1 Canada---Lake Mani
toba
PO 1050 1 Canada---Lake Mani
toba
PS 519 1 Canada---Lake Mani
toba
CO 46 1 Canada---Lake Win
nipeg
PO 1052 1 Canada---Lake Win
nipeg
PS 521 1 Canada---Lake Win
nipeg
CO 43 1 Canada---Lake Win
nipegosis
PO 1049 1 Canada---Lake Win
nipegosis
PS 518 1 Canada---Lake Win
nipegosis
CO 38 2 Canada---Lougheed Is.
PO 1044 6 Canada---Lougheed Is.
PS 508 6 Canada---Lougheed Is.
CO 34 2 Canada---Mackenzie
King Is.
PO 1040 6 Canada---Mackenzie
King Is.
PS 499 6 Canada---Mackenzie
King Is.
CO 60 2 Canada---Manitoulin
Is.
PO 1072 6 Canada---Manitoulin
Is.
CO 64 2 Canada---Mansel Is.
PO 1079 6 Canada---Mansel Is.
PS 642 6 Canada---Mansel Is.
CO 45 2 Canada---Meighen Is.
PO 1051 6 Canada---Meighen Is.
PS 520 6 Canada---Meighen Is.
CO 30 2 Canada---Melville Is.
PO 1035 6 Canada---Melville Is.
PS 488 6 Canada---Melville Is.
PO 1118 6 Canada---Newfound
land
PS 760 6 Canada---Newfound
land
CO 71 2 Canada---Prince
Charles Is.
PO 1087 6 Canada---Prince
Charles Is.
PS 661 6 Canada---Prince
Charles Is.
CO 84 2 Canada---Prince
Edward Is.
PO 1107 6 Canada---Prince
Edward Is.
PS 749 6 Canada---Prince
Edward Is.
CO 42 2 Canada---Prince of
Wales Is.
PO 1048 6 Canada---Prince of
Wales Is.
PS 516 6 Canada---Prince of
Wales Is.
CO 27 2 Canada---Prince
Patrick Is.
PO 1032 6 Canada---Prince
Patrick Is.
PS 470 6 Canada---Prince
Patrick Is.
CO 23 2 Canada---Queen Char
lotte Is.
PO 1027 6 Canada---Queen Char
lotte Is.
PS 463 6 Canada---Queen Char
lotte Is.
CO 41 1 Canada---Reindeer
Lake
PO 1047 1 Canada---Reindeer
Lake
PS 514 1 Canada---Reindeer
Lake
CO 56 2 Canada---Southamp
ton Is.
PO 1067 6 Canada---Southamp
ton Is.
PS 590 6 Canada---Southamp
ton Is.
CO 24 2 Canada---Vancouver
Is.
PO 1028 6 Canada---Vancouver
Is.
PS 464 6 Canada---Vancouver
Is.
CO 29 2 Canada---Victoria Is.
PO 1034 6 Canada---Victoria Is.
PS 485 6 Canada---Victoria Is.
CO 100 2 Canary Is.
CO 101 2 Canary Is.
CO 102 2 Canary Is.
CO 103 2 Canary Is.
PO 1130 2 Canary Is.
PO 1133 2 Canary Is.
PO 1135 2 Canary Is.
PO 1136 2 Canary Is.
PS 772 2 Canary Is.
PS 775 2 Canary Is.
PS 777 2 Canary Is.
PS 778 2 Canary Is.
CO 134 1 Caspian Sea
PO 1249 1 Caspian Sea
PS 891 1 Caspian Sea
PO 1196 5 Central African
Republic
PS 838 5 Central African
Republic
PO 1194 2 Chad
PS 836 2 Chad
PO 1090 2 Chile
PS 693 2 Chile
PS 702 2 Chile---Is.la de Chiloe
PO 1093 2 Chile---Isla de Chiloe
PO 1091 2 Chile---Tierra del
Fuego
PS 699 2 Chile---Tierra del
Fuego
PO 1270 5 China
PS 912 5 China
CO 159 2 China---Hainan Dao
PO 1292 5 China---Hainan Dao
(island)
PS 934 5 China---Hainan Dao
(island)
US 339 1 Clark Hill Reservoir
PO 1082 2 Colombia
PS 647 2 Colombia
US 251 6 Colorado
PO 1185 2 Congo
PS 827 2 Congo
US 409 5 Connecticut
CO 111 2 Corsica
PO 1173 3 Corsica
PS 815 3 Corsica
PO 1068 2 Costa Rica
PS 596 2 Costa Rica
CO 122 2 Crete
PO 1212 2 Crete
PS 854 2 Crete
CO 57 2 Cuba
PO 1069 4 Cuba
PS 602 4 Cuba
CO 61 2 Cuba---Isla de Pinos
PO 1073 4 Cuba---Isla de Pinos
PS 616 4 Cuba---Isla de Pinos
CO 80 2 Curacao
PO 1102 3 Curacao
PS 735 3 Curacao
CO 128 2 Cyprus
PO 1228 3 Cyprus
PS 870 3 Cyprus
PO 1189 2 Czechoslovakia
PS 831 2 Czechoslovakia
US 393 5 Delaware
US 402 1 Delaware---bay
CO 112 2 Denmark---Fyn
PO 1179 2 Denmark---Fyn
PS 821 2 Denmark---Fyn
PO 1169 2 Denmark---Jutland
PS 811 2 Denmark---Jutland
CO 113 2 Denmark---Lolland
PO 1181 2 Denmark---Lolland
PS 823 2 Denmark---Lolland
CO 115 2 Denmark---Sjaelland
PO 1183 2 Denmark---Sjaelland
PS 825 2 Denmark---Sjaelland
PO 1272 4 Disputed area between
India and China
PS 914 4 Disputed area between
India and China
PO 1242 3 Djibouti
PS 884 3 Djibouti
PO 1100 3 Dominican Republic
PS 724 3 Dominican Republic
PO 1180 3 East Germany
PS 822 3 East Germany
PO 1077 3 Ecuador
PS 632 3 Ecuador
PO 1213 6 Egypt
PS 855 6 Egypt
PO 1061 4 El Salvador
PS 567 4 El Salvador
PO 1150 5 England
PS 792 5 England
PO 1175 6 Equatorial Guinea
PS 817 6 Equatorial Guinea
PO 1230 4 Ethiopia
PS 872 4 Ethiopia
CO 105 2 Faeroe Is.
PO 1147 2 Faeroe Is.
PS 789 2 Faeroe Is.
CO 89 2 Faulkland Is.
PO 1114 5 Faulkland Is.
PS 756 5 Faulkland Is.
CO 222 2 Fiji---Vanua Levu
PO 1360 3 Fiji---Vanua Levu
PS 1002 3 Fiji---Vanua Levu
CO 221 2 Fiji---Viti Levu
PO 1359 3 Fiji---Viti Levu
PS 1001 3 Fiji---Viti Levu
PO 1205 3 Finland
PS 847 3 Finland
US 313 4 Florida
US 322 4 Florida---island
US 348 4 Florida---island
US 349 4 Florida---island
US 350 4 Florida---island
US 351 4 Florida---island
US 353 4 Florida---island
US 343 4 Florida---Keys
US 344 4 Florida---Keys
US 345 4 Florida---Keys
US 346 4 Florida---Keys
US 319 1 Florida---lake
US 347 1 Florida---Lake
Okeechobee
US 341 4 Florida---Pine Is.
US 340 4 Florida---Sanibel Is.
PO 1153 3 France
PS 795 3 France
PO 1122 3 French Guiana
PS 764 3 French Guiana
PO 1174 5 Gabon
PS 816 5 Gabon
CO 52 2 Galapagos Is.
PO 1059 3 Galapagos Is.
PS 553 3 Galapagos Is.
PO 1132 2 Gambia
PS 774 2 Gambia
US 320 6 Georgia
PO 1154 5 Ghana
PS 796 5 Ghana
CO 118 2 Gotland
PO 1199 2 Gotland
PS 841 2 Gotland
US 248 1 Great Salt Lake
CO 119 2 Greece
PO 1202 2 Greece
PO 1206 2 Greece
PS 844 2 Greece
PS 848 2 Greece
CO 79 2 Green
PO 1099 2 Greenland
PS 718 2 Greenland
CO 98 2 Greenland---off-shore
island
PO 1126 2 Greenland---off-shore
island
PS 768 2 Greenland---off-shore
island
CO 88 2 Guadeloupe---east
PO 1112 3 Guadeloupe---east
PS 754 3 Guadeloupe---east
CO 87 2 Guadeloupe---west
PO 1111 3 Guadeloupe---west
PS 753 3 Guadeloupe---west
PO 1057 3 Guatemala
PS 549 3 Guatemala
PO 1134 5 Guinea
PS 776 5 Guinea
PO 1131 4 Guinea-Bissau
PS 773 4 Guinea-Bissau
PO 1113 4 Guyana
PS 755 4 Guyana
PO 1092 6 Haiti
PS 700 6 Haiti
CO 75 2 Haiti and the Domini
can Republic
CO 19 2 Hawaiian Is.---Hawaii
PO 1022 3 Hawaiian Is.---Hawaii
PS 458 3 Hawaiian Is.---Hawaii
CO 16 2 Hawaiian Is.---Kauai
PO 1019 3 Hawaiian Is.---Kauai
PS 455 3 Hawaiian Is.---Kauai
CO 18 2 Hawaiian Is.---Maui
PO 1021 3 Hawaiian Is.---Maui
PS 457 3 Hawaiian Is.---Maui
CO 15 2 Hawaiian Is.---Niihau
PO 1018 3 Hawaiian Is.---Niihau
PS 454 3 Hawaiian Is.---Niihau
CO 17 2 Hawaiian Is.---Oahu
PO 1020 3 Hawaiian Is.---Oahu
PS 456 3 Hawaiian Is.---Oahu
PO 1063 5 Honduras
PS 572 5 Honduras
PO 1197 5 Hungary
PS 839 5 Hungary
CO 97 2 Iceland
PO 1125 7 Iceland
PS 767 7 Iceland
US 242 6 Idaho
CO 146 2 Ile Kerguelen
PO 1268 3 Ile Kerguelen
PS 910 3 Ile Kerguelen
US 284 4 Illinois
PO 1267 2 India
PS 909 2 India
US 311 5 Indiana
CO 177 2 Indonesia---Alor
PO 1312 5 Indonesia---Alor
PS 954 5 Indonesia---Alor
CO 164 2 Indonesia---Bali
PO 1299 5 Indonesia---Bali
PS 941 5 Indonesia---Bali
CO 156 2 Indonesia---Bangka
PO 1289 5 Indonesia---Bangka
PS 931 5 Indonesia---Bangka
CO 162 2 Indonesia---Bawean
PO 1296 5 Indonesia---Bawean
PS 938 5 Indonesia---Bawean
CO 158 2 Indonesia---Belitung
PO 1291 5 Indonesia---Belitung
PS 933 5 Indonesia---Belitung
CO 192 2 Indonesia---Biak and
Kepulauan Schouten
PO 1329 5 Indonesia---Biak and
Kepulauan Schouten
PS 971 5 Indonesia---Biak and
Kepulauan Schouten
PO 1293 5 Indonesia---Borneo---
Kalimantan
PS 935 5 Indonesia---Borneo---
Kalimantan
CO 180 2 Indonesia---Buru
PO 1316 5 Indonesia---Buru
PS 958 5 Indonesia---Buru
CO 183 2 Indonesia---Ceram
PO 1320 5 Indonesia---Ceram
PS 962 5 Indonesia---Ceram
CO 169 2 Indonesia---Flores
PO 1304 5 Indonesia---Flores
PS 946 5 Indonesia---Flores
CO 182 2 Indonesia---Halmahera
PO 1319 5 Indonesia---Halmahera
PS 961 5 Indonesia---Halmahera
CO 175 2 Indonesia---island
PO 1310 5 Indonesia---island
PS 952 5 Indonesia---island
CO 157 2 Indonesia---Java
PO 1290 5 Indonesia---Java
PS 932 5 Indonesia---Java
CO 191 2 Indonesia---Kepu
lauan Aru
PO 1328 5 Indonesia---Kepu
lauan Aru
PS 970 5 Indonesia---Kepu
lauan Aru
CO 189 2 Indonesia---Kepu
lauan Tanimbar
PO 1326 5 Indonesia---Kepu
lauan Tanimbar
PS 968 5 Indonesia---Kepu
lauan Tanimbar
PO 1324 5 Indonesia---New
Guinea---Irian Jaya
PS 966 5 Indonesia---New
Guinea---Irian Jaya
CO 152 2 Indonesia---Nias
PO 1281 5 Indonesia---Nias
PS 923 5 Indonesia---Nias
CO 181 2 Indonesia---Obi
PO 1318 5 Indonesia---Obi
PS 960 5 Indonesia---Obi
CO 153 2 Indonesia---Siberut
PO 1283 5 Indonesia---Siberut
PS 925 5 Indonesia---Siberut
CO 167 2 Indonesia---Sulawesi
(Celebes)
PO 1302 5 Indonesia---Sulawesi
(Celebes)
PS 944 5 Indonesia---Sulawesi
(Celebes)
CO 151 2 Indonesia---Sumatra
PO 1280 5 Indonesia---Sumatra
PS 922 5 Indonesia---Sumatra
CO 168 2 Indonesia---Sumba
PO 1303 5 Indonesia---Sumba
PS 945 5 Indonesia---Sumba
PS 942 5 Indonesia---Sumbawa
& Lombok
CO 165 2 Indonesia---Sumbawa
and Lombok
PO 1300 5 Indonesia---Sumbawa
and Lombok
CO 176 2 Indonesia---Timor
PO 1311 5 Indonesia---Timor
PS 953 5 Indonesia---Timor
CO 186 2 Indonesia---Waigeo
PO 1323 5 Indonesia---Waigeo
PS 965 5 Indonesia---Waigeo
CO 179 2 Indonesia---Wetar
PO 1315 5 Indonesia---Wetar
PS 957 5 Indonesia---Wetar
US 262 6 Iowa
PO 1246 5 Iran
PS 888 5 Iran
PO 1240 6 Iraq
PS 882 6 Iraq
CO 104 2 Ireland
PO 1141 4 Ireland
PS 783 4 Ireland
CO 76 2 Isla de Chiloe
PO 1233 2 Israel
PS 875 2 Israel
PO 1167 6 Italy
PS 809 6 Italy
PO 1145 4 Ivory Coast
PS 787 4 Ivory Coast
CO 69 2 Jamaica
PO 1085 5 Jamaica
PS 650 5 Jamaica
CO 196 2 Japan---Hokkaido
PO 1333 3 Japan---Hokkaido
PS 975 3 Japan---Hokkaido
CO 188 2 Japan---Honshu
PO 1325 3 Japan---Honshu
PS 967 3 Japan---Honshu
CO 184 2 Japan---Kyushu
PO 1321 3 Japan---Kyushu
PS 963 3 Japan---Kyushu
CO 190 2 Japan---Shikoku
PO 1327 3 Japan---Shikoku
PS 969 3 Japan---Shikoku
PO 1237 5 Jordan
PS 879 5 Jordan
US 257 4 Kansas
US 299 6 Kentucky
PO 1231 5 Kenya
PS 873 5 Kenya
PO 1361 2 Kuwait
PS 1003 2 Kuwait
CO 117 1 Lake Chad
PO 1192 1 Lake Chad
PS 834 1 Lake Chad
US 411 1 Lake Champlain
US 413 2 Lake Champlain---
Grand Isle
CO 59 1 Lake Erie
PO 1071 1 Lake Erie
US 333 1 Lake Erie
US 354 2 Lake Erie---Long Point
(land)
US 329 1 Lake George
US 337 2 Lake Huron---Barrie
Is.
US 325 2 Lake Huron---Bois
Blanc Is.
US 355 2 Lake Huron---Chris
tian Is.
US 332 2 Lake Huron---Cock
burn Is.
US 330 2 Lake Huron---Drum
mond Is.
US 342 2 Lake Huron---Fitzwill
iam Is.
US 335 2 Lake Huron---Mani
toulin Is.
US 246 1 Lake Mead (east)
US 244 1 Lake Mead (west)
US 321 2 Lake Michigan---Bea
ver Is.
US 317 2 Lake Michigan---Man
itou Is.
US 314 2 Lake Michigan---
Washington Is.
CO 129 1 Lake Nyasa
PO 1232 1 Lake Nyasa
PS 874 1 Lake Nyasa
CO 66 1 Lake Ontario
PO 1081 1 Lake Ontario
US 357 1 Lake Ontario
US 371 2 Lake Ontario---island
US 375 2 Lake Ontario---island
US 377 2 Lake Ontario---island
US 323 1 Lake Seminole
US 336 1 Lake St. Clair
CO 51 1 Lake Superior
PO 1058 1 Lake Superior
US 281 1 Lake Superior
US 316 2 Lake Superior---
Grand Is.
US 326 2 Lake Superior---island
US 307 2 Lake Superior---Isle
Royale
US 286 2 Lake Superior---Made
line Is.
US 318 2 Lake Superior---Mich
ipicoten Is.
US 288 2 Lake Superior---Oak
Is.
US 292 2 Lake Superior---Outer
Is.
US 308 2 Lake Superior---Pie Is.
US 289 2 Lake Superior---Stock
ton Is.
US 236 1 Lake Tahoe
CO 125 1 Lake Tanganyika
PO 1220 1 Lake Tanganyika
PS 862 1 Lake Tanganyika
US 261 1 Lake Texoma
CO 127 1 Lake Victoria
PO 1227 1 Lake Victoria
PS 869 1 Lake Victoria
CO 55 1 Lakes Michigan and
Huron
PO 1065 1 Lakes Michigan and
Huron
US 312 1 Lakes Michigan and
Huron
PO 1285 6 Laos
PS 927 6 Laos
PO 1238 3 Lebanon
PS 880 3 Lebanon
PO 1216 6 Lesotho
PS 858 6 Lesotho
PO 1140 3 Liberia
PS 782 3 Liberia
PO 1176 4 Libya
PS 818 4 Libya
PO 1177 4 Liechtenstein
PS 819 4 Liechtenstein
CO 77 2 Long Is.
PO 1095 3 Long Is.
US 417 1 Long Is.---Great South
Bay
US 272 4 Louisiana
US 275 1 Louisiana---Calcasieu
Lake
US 309 4 Louisiana---Cat Is.
US 278 1 Louisiana---Grand
Lake
US 285 4 Louisiana---island
US 287 4 Louisiana---island
US 296 4 Louisiana---island
US 297 4 Louisiana---island
US 298 4 Louisiana---island
US 300 4 Louisiana---island
US 301 4 Louisiana---island
US 302 4 Louisiana---island
US 303 4 Louisiana---island
US 304 4 Louisiana---island
US 305 4 Louisiana---island
US 306 4 Louisiana---island
US 290 1 Louisiana---Lake Mau
repas
US 294 1 Louisiana---Lake Pont
chartrain
US 282 4 Louisiana---Marsh Is.
US 273 1 Louisiana---Sabine
Lake
US 291 4 Louisiana---Timbalier
Is.
US 280 1 Louisiana---White
Lake
PO 1164 5 Luxembourg
PS 806 5 Luxembourg
CO 110 2 "Macias Nguema
Biyogo (African
island, Fernando Po)"
PO 1172 3 "Macias Nguema
Biyogo (African
island, Fernando Po)"
PS 814 3 "Macias Nguema
Biyogo (African
island, Fernando Po)"
CO 132 2 Madagascar
PO 1244 3 Madagascar
PS 886 3 Madagascar
US 427 5 Maine
US 431 5 Maine---island
US 432 5 Maine---island
US 433 5 Maine---island
US 434 5 Maine---island
US 435 5 Maine---island
US 436 5 Maine---island
US 437 5 Maine---island
US 438 5 Maine---island
US 439 5 Maine---island
PO 1229 2 Malawi
PS 871 2 Malawi
PO 1294 6 Malaysia---Borneo---
Malaysia Timor
PS 936 6 Malaysia---Borneo---
Malaysia Timor
PO 1201 6 Malaysia---Malay Pen
insula
PS 843 6 Malaysia---Malay Pen
insula
PO 1139 6 Mali
PS 781 6 Mali
CO 108 2 Mallorca
PO 1159 2 Mallorca
PS 801 2 Mallorca
CO 90 2 Martinique
PO 1115 3 Martinique
PS 757 3 Martinique
US 358 4 Maryland
US 403 4 Maryland
US 404 4 Maryland
US 386 1 Maryland---inlet
US 376 4 Maryland---island
US 378 4 Maryland---island
US 380 4 Maryland---island
US 381 4 Maryland---island
US 410 4 Massachusetts
US 426 1 Massachusetts---bay
US 430 1 Massachusetts---inlet
US 428 4 Massachusetts---Mar
thas Vineyard
US 429 4 Massachusetts---Nan
tucket Is.
PO 1129 4 Mauritania
PS 771 4 Mauritania
CO 142 2 Mauritius
PO 1261 3 Mauritius
PS 903 3 Mauritius
PO 1037 6 Mexico
PS 491 6 Mexico
US 315 2 Michigan (lower)
US 293 2 Michigan (upper)
US 260 4 Minnesota
US 264 1 Minnesota---Lake of
the Woods
US 268 4 Minnesota---Lake of
the Woods---island
US 269 4 Minnesota---Lake of
the Woods---island
US 271 4 Minnesota---Lake of
the Woods---island
US 266 4 Minnesota---Lake of
the Woods---land west
of lake
US 279 4 Minnesota---little
piece
US 276 1 Minnesota---Namakan
Lake
US 274 1 Minnesota---Rainy
Lake
US 265 1 Minnesota---Shoal
Lake
US 283 2 Mississippi
US 263 2 Missouri
PO 1275 3 Mongolia
PS 917 3 Mongolia
US 243 5 Montana
PO 1138 5 Morocco
PS 780 5 Morocco
PO 1225 4 Mozambique
PS 867 4 Mozambique
PO 1186 2 Namibia
PS 828 2 Namibia
US 253 5 Nebraska
PO 1274 3 Nepal
PS 916 3 Nepal
PO 1162 3 Netherlands
PS 804 3 Netherlands
US 237 5 Nevada
CO 212 2 New Caledonia
(island)
PO 1350 3 New Caledonia
(island)
PS 992 3 New Caledonia
(island)
CO 187 2 New Guinea
PO 1336 3 New Guinea---Papua
PS 978 3 New Guinea---Papua
US 418 6 New Hampshire
US 414 1 New Hampshire---lake
US 416 1 New Hampshire---lake
CO 215 2 New Hebrides---Espir
itu Santo
PO 1353 3 New Hebrides---Espir
itu Santo
PS 995 3 New Hebrides---Espir
itu Santo
CO 216 2 New Hebrides---Male
kula
PO 1354 3 New Hebrides---Male
kula
PS 996 3 New Hebrides---Male
kula
US 400 2 New Jersey
US 405 2 New Jersey---island
US 407 1 New Jersey---Newark
Bay
US 250 5 New Mexico
US 356 3 New York
US 420 3 New York---Fishers Is.
US 408 3 New York---Long Is.
US 419 3 New York---Shelter Is.
CO 6 2 New Zealand---
Chatham Is.
PO 1009 6 New Zealand---
Chatham Is.
PS 445 6 New Zealand---
Chatham Is.
CO 219 2 New Zealand---North
Is.
CO 220 2 New Zealand---North
Is.
PO 1357 6 New Zealand---North
Is.
PO 1358 6 New Zealand---North
Is.
PS 999 6 New Zealand---North
Is.
PS 1000 6 New Zealand---North
Is.
CO 214 2 New Zealand---South
Is.
PO 1352 6 New Zealand---South
Is.
PS 994 6 New Zealand---South
Is.
CO 217 2 New Zealand---Stew
art Is.
PO 1355 6 New Zealand---Stew
art Is.
PS 997 6 New Zealand---Stew
art Is.
CO 93 2 Newfoundland
PO 1066 6 Nicaragua
PS 588 6 Nicaragua
PO 1156 5 Niger
PS 798 5 Niger
PO 1161 4 Nigeria
PS 803 4 Nigeria
CO 11 2 North and South
America
US 328 4 North Carolina
US 361 4 North Carolina---Cape
Fear
US 383 4 North Carolina---
island
US 384 4 North Carolina---
island
US 388 4 North Carolina---
island
US 391 4 North Carolina---
island
US 392 4 North Carolina---
island
US 395 4 North Carolina---
island
US 396 4 North Carolina---
island
US 397 4 North Carolina---
island
US 398 4 North Carolina---
island
US 399 4 North Carolina---
island
US 255 3 North Dakota
PO 1314 2 North Korea
PS 956 2 North Korea
PO 1146 5 Northern Ireland
PS 788 5 Northern Ireland
PO 1163 4 Norway
PS 805 4 Norway
CO 2 1 Oceans
PO 1005 1 Oceans
PS 441 1 Oceans
US 324 4 Ohio
US 256 3 Oklahoma
PO 1254 4 Oman---northern sec
tion
PS 896 4 Oman---northern sec
tion
PO 1260 4 Oman---southern sec
tion
PS 902 4 Oman---southern sec
tion
US 225 3 Oregon
CO 106 2 Outer Hebrides
PO 1148 2 Outer Hebrides
PS 790 2 Outer Hebrides
PO 1265 4 Pakistan
PS 907 4 Pakistan
PO 1074 5 Panama
PS 617 5 Panama
PO 1109 5 Paraguay
PS 751 5 Paraguay
US 352 6 Pennsylvania
PO 1076 5 Peru
PS 630 5 Peru
CO 170 2 Philippines---Luzon
PO 1305 4 Philippines---Luzon
PS 947 4 Philippines---Luzon
CO 174 2 Philippines---Mind
anao
PO 1309 4 Philippines---Mind
anao
PS 951 4 Philippines---Mind
anao
CO 172 2 Philippines---Mindoro
PO 1307 4 Philippines---Mindoro
PS 949 4 Philippines---Mindoro
CO 166 2 Philippines---Palawan
PO 1301 4 Philippines---Palawan
PS 943 4 Philippines---Palawan
CO 173 2 "Philippines---Panay,
Negros, and Bohol"
PO 1308 4 "Philippines---Panay,
Negros, and Bohol"
PS 950 4 "Philippines---Panay,
Negros, and Bohol"
CO 178 2 Philippines---Samar
PO 1313 4 Philippines---Samar
PS 955 4 Philippines---Samar
PO 1195 5 Poland
PS 837 5 Poland
PO 1142 4 Portugal
PS 784 4 Portugal
CO 81 2 Puerto Rico
PO 1104 3 Puerto Rico
PS 746 3 Puerto Rico
PO 1252 4 Qatar
PS 894 4 Qatar
CO 140 2 Reunion Is.
PO 1258 3 Reunion Is.
PS 900 3 Reunion Is.
US 421 6 Rhode Is.
US 422 6 Rhode Is.---Block Is.
US 423 6 Rhode Is.---island
US 424 6 Rhode Is.---island
US 425 6 Rhode Is.---island
CO 124 2 Rhodes
PO 1218 2 Rhodes
PS 860 2 Rhodes
PO 1204 3 Romania
PS 846 3 Romania
PO 1219 5 Rwanda
PS 861 5 Rwanda
CO 7 2 Samoa---Savaii
PO 1010 3 Samoa---Savaii
PS 446 3 Samoa---Savaii
CO 8 2 Samoa---Upolu
PO 1011 3 Samoa---Upolu
PS 447 3 Samoa---Upolu
CO 109 2 Sardinia
PO 1170 6 Sardinia
PS 812 6 Sardinia
PO 1236 3 Saudi Arabia
PS 878 3 Saudi Arabia
US 327 1 Sault Ste. Marie
PO 1149 2 Scotland
PS 791 2 Scotland
CO 107 2 Scotland/England/Wal
es
PO 1127 3 Senegal
PS 769 3 Senegal
CO 116 2 Sicily
PO 1191 6 Sicily
PS 833 6 Sicily
PO 1137 6 Sierra Leone
PS 779 6 Sierra Leone
CO 207 2 Solomon Is.---Bouga
inville
PO 1345 3 Solomon Is.---Bouga
inville
PS 987 3 Solomon Is.---Bouga
inville
CO 209 2 Solomon Is.---Guadal
canal
PO 1347 3 Solomon Is.---Guadal
canal
PS 989 3 Solomon Is.---Guadal
canal
CO 210 2 Solomon Is.---San
Cristobal
PO 1348 3 Solomon Is.---San
Cristobal
PS 990 3 Solomon Is.---San
Cristobal
PO 1241 2 Somalia
PS 883 2 Somalia
PO 1198 5 South Africa
PS 840 5 South Africa
US 334 2 South Carolina
US 254 2 South Dakota
CO 96 2 South Georgia Is.
PO 1124 5 South Georgia Is.
PS 766 5 South Georgia Is.
PO 1317 4 South Korea
PS 959 4 South Korea
PO 1143 2 Spain
PS 785 2 Spain
CO 149 2 Sri Lanka (Ceylon)
PO 1273 5 Sri Lanka (Ceylon)
PS 915 5 Sri Lanka (Ceylon)
US 406 3 Staten Is.
PO 1208 3 Sudan
PS 850 3 Sudan
PO 1120 5 Surinam
PS 762 5 Surinam
CO 114 2 Svalbard
PO 1182 4 Svalbard
PS 824 4 Svalbard
PO 1226 6 Swaziland
PS 868 6 Swaziland
PO 1184 5 Sweden
PS 826 5 Sweden
PO 1165 5 Switzerland
PS 807 5 Switzerland
PO 1239 4 Syria
PS 881 4 Syria
CO 22 2 Tahiti
PO 1025 3 Tahiti
PS 461 3 Tahiti
CO 171 2 Taiwan
PO 1306 2 Taiwan
PS 948 2 Taiwan
PO 1223 3 Tanzania
PS 865 3 Tanzania
US 295 3 Tennessee
US 252 2 Texas
US 258 2 Texas---island
US 267 2 Texas---island
US 259 2 Texas---Padre Is.
PO 1282 5 Thailand
PS 924 5 Thailand
CO 74 2 Tierra del Fuego
PO 1155 6 Togo
PS 797 6 Togo
CO 86 2 Trinidad and Tobago
PO 1110 6 Trinidad and Tobago
PS 752 6 Trinidad and Tobago
PO 1168 5 Tunisia
PS 810 5 Tunisia
PO 1215 3 Turkey
PS 857 3 Turkey
CO 78 2 Turks and Caicos Is.
PO 1096 4 Turks and Caicos Is.
PS 708 4 Turks and Caicos Is.
PO 1222 2 Uganda
PS 864 2 Uganda
PO 1251 2 United Arab Emirates
PS 893 2 United Arab Emirates
PO 1248 4 Unnamed neutral zone
between Iraq and Saudi
Arabia
PS 890 4 Unnamed neutral zone
between Iraq and Saudi
Arabia
PO 1151 2 Upper Volta
PS 793 2 Upper Volta
PO 1119 2 Uruguay
PS 761 2 Uruguay
PO 1031 3 US
PO 1006 6 USSR
PS 442 6 USSR
CO 143 1 USSR---Aral Sea
PO 1262 1 USSR---Aral Sea
PS 904 1 USSR---Aral Sea
CO 130 1 USSR---Azov Sea
PO 1234 1 USSR---Azov Sea
PS 876 1 USSR---Azov Sea
CO 133 2 USSR---Franz Josef
Land
CO 137 2 USSR---Franz Josef
Land
CO 139 2 USSR---Franz Josef
Land
CO 141 2 USSR---Franz Josef
Land
CO 144 2 USSR---Franz Josef
Land
CO 145 2 USSR---Franz Josef
Land
PO 1247 6 USSR---Franz Josef
Land
PO 1255 6 USSR---Franz Josef
Land
PO 1257 6 USSR---Franz Josef
Land
PO 1259 6 USSR---Franz Josef
Land
PO 1263 6 USSR---Franz Josef
Land
PO 1266 6 USSR---Franz Josef
Land
PS 889 6 USSR---Franz Josef
Land
PS 897 6 USSR---Franz Josef
Land
PS 899 6 USSR---Franz Josef
Land
PS 901 6 USSR---Franz Josef
Land
PS 905 6 USSR---Franz Josef
Land
PS 908 6 USSR---Franz Josef
Land
CO 155 1 USSR---Lake Baikal
PO 1288 1 USSR---Lake Baikal
PS 930 1 USSR---Lake Baikal
CO 148 1 USSR---Lake
Balkhash (east)
PO 1271 1 USSR---Lake
Balkhash (east)
PS 913 1 USSR---Lake
Balkhash (east)
CO 147 1 USSR---Lake
Balkhash (west)
PO 1269 1 USSR---Lake
Balkhash (west)
PS 911 1 USSR---Lake
Balkhash (west)
CO 136 2 USSR---Novaya Zem
lya
PO 1253 6 USSR---Novaya Zem
lya
PS 895 6 USSR---Novaya Zem
lya
CO 131 1 USSR---Onazhskoye
Ozero
PO 1235 1 USSR---Onazhskoye
Ozero
PS 877 1 USSR---Onazhskoye
Ozero
CO 154 2 USSR---Ostrov Bol'
shevik
PO 1284 6 USSR---Ostrov Bol'
shevik
PS 926 6 USSR---Ostrov Bol'
shevik
CO 161 2 USSR---Ostrov
Bol'shoy Begichev
PO 1295 6 USSR---Ostrov
Bol'shoy Begichev
PS 937 6 USSR---Ostrov
Bol'shoy Begichev
CO 198 2 USSR---Ostrov B
ol'shoy Lyakhovskiy
PO 1335 6 USSR---Ostrov
Bol'shoy Lyakhovskiy
PS 977 6 USSR---Ostrov
Bol'shoy Lyakhovskiy
CO 121 2 USSR---Ostrov Hiiu
maa
PO 1210 6 USSR---Ostrov Hiiu
maa
PS 852 6 USSR---Ostrov Hiiu
maa
CO 202 2 USSR---Ostrov Iturup
PO 1340 6 USSR---Ostrov Iturup
PS 982 6 USSR---Ostrov Iturup
CO 211 2 USSR---Ostrov Kara
ginskiy
PO 1349 6 USSR---Ostrov Kara
ginskiy
PS 991 6 USSR---Ostrov Kara
ginskiy
CO 135 2 USSR---Ostrov
Kolguyev
PO 1250 6 USSR---Ostrov
Kolguyev
PS 892 6 USSR---Ostrov
Kolguyev
CO 194 2 USSR---Ostrov Kotel'
nyy and Ostrov Fad
deyevskiy
PO 1331 6 USSR---Ostrov Kotel'
nyy and Ostrov Fad
deyevskiy
PS 973 6 USSR---Ostrov Kotel'
nyy and Ostrov Fad
deyevskiy
CO 197 2 USSR---Ostrov Malyy
Lyakhovskiy
PO 1334 6 USSR---Ostrov Malyy
Lyakhovskiy
PS 976 6 USSR---Ostrov Malyy
Lyakhovskiy
CO 201 2 USSR---Ostrov
Novaya Sibir'
PO 1339 6 USSR---Ostrov
Novaya Sibir'
PS 981 6 USSR---Ostrov
Novaya Sibir'
CO 150 2 "USSR---Ostrov Okty
abr'skoy Revolyutsii,
Komsomolets, Pioner"
PO 1278 6 "USSR---Ostrov Okty
abr'skoy Revolyutsii,
Komsomolets, Pioner"
PS 920 6 "USSR---Ostrov Okty
abr'skoy Revolyutsii,
Komsomolets, Pioner"
CO 208 2 USSR---Ostrov Para
mushir
PO 1346 6 USSR---Ostrov Para
mushir
PS 988 6 USSR---Ostrov Para
mushir
CO 120 2 USSR---Ostrov Saare
maa
PO 1207 6 USSR---Ostrov Saare
maa
PS 849 6 USSR---Ostrov Saare
maa
CO 199 2 USSR---Ostrov Sakha
lin
PO 1337 6 USSR---Ostrov Sakha
lin
PS 979 6 USSR---Ostrov Sakha
lin
CO 204 2 USSR---Ostrov Urup
PO 1342 6 USSR---Ostrov Urup
PS 984 6 USSR---Ostrov Urup
CO 126 1 USSR---Ozero
Ladozhskoye (Lake
Ladoga)
PO 1224 1 USSR---Ozero
Ladozhskoye (Lake
Ladoga)
PS 866 1 USSR---Ozero
Ladozhskoye (Lake
Ladoga)
CO 195 2 USSR---Shantarskiye
Ostrova
PO 1332 6 USSR---Shantarskiye
Ostrova
PS 974 6 USSR---Shantarskiye
Ostrova
CO 4 2 USSR---Wrangel Is.
PO 1007 6 USSR---Wrangel Is.
PS 443 6 USSR---Wrangel Is.
PS 585 5 US---Alabama
PS 495 2 US---Arizona
PS 538 5 US---Arkansas
PS 649 4 US---Bahamas---
Andros
PS 652 4 US---Bahamas---
Andros
PS 653 4 US---Bahamas---
Andros
PS 655 4 US---Bahamas---
Andros
PS 658 4 US---Bahamas---
Andros
PS 687 4 US---Bahamas---Cat
Is.
PS 663 4 US---Bahamas---
Eleuthera Is.
PS 664 4 US---Bahamas---
Eleuthera Is.
PS 665 4 US---Bahamas---
Eleuthera Is.
PS 648 4 US---Bahamas---
Grand Bahama
PS 656 4 US---Bahamas---
Grand Bahama
PS 657 4 US---Bahamas---
Grand Bahama
PS 654 4 US---Bahamas---
Great Abaco and Little
Abaco
PS 659 4 US---Bahamas---
Mores Is.
PS 660 4 US---Bahamas---New
Providence Is.
PS 469 4 US---California
PS 486 4 US---California---San
Clemente Is.
PS 478 4 US---California---San
Miguel Is.
PS 483 4 US---California---San
Nicholas Is.
PS 487 4 US---California---
Santa Catalina Is.
PS 482 4 US---California---
Santa Cruz Is.
PS 479 4 US---California---
Santa Rosa Is.
PS 621 1 US---Clark Hill Reser
voir
PS 505 6 US---Colorado
PS 707 5 US---Connecticut
PS 686 5 US---Delaware
PS 696 1 US---Delaware---bay
PS 589 4 US---Florida
PS 600 4 US---Florida---island
PS 633 4 US---Florida---island
PS 635 4 US---Florida---island
PS 636 4 US---Florida---island
PS 637 4 US---Florida---island
PS 639 4 US---Florida---island
PS 626 4 US---Florida---Keys
PS 627 4 US---Florida---Keys
PS 628 4 US---Florida---Keys
PS 629 4 US---Florida---Keys
PS 597 1 US---Florida---lake
PS 631 1 US---Florida---Lake
Okeechobee
PS 623 4 US---Florida---Pine Is.
PS 622 4 US---Florida---Sani
bel Is.
PS 598 6 US---Georgia
PS 500 1 US---Great Salt Lake
PS 489 6 US---Idaho
PS 554 4 US---Illinois
PS 586 5 US---Indiana
PS 527 6 US---Iowa
PS 517 4 US---Kansas
PS 573 6 US---Kentucky
PS 711 1 US---Lake Champlain
PS 714 2 US---Lake Cham
plain---Grand Isle
PS 613 1 US---Lake Erie
PS 640 2 US---Lake Erie---
Long Point (land)
PS 608 1 US---Lake George
PS 619 2 US---Lake Huron---
Barrie Is.
PS 604 2 US---Lake Huron---
Bois Blanc Is.
PS 641 2 US---Lake Huron---
Christian Is.
PS 612 2 US---Lake Huron---
Cockburn Is.
PS 609 2 US---Lake Huron---
Drummond Is.
PS 625 2 US---Lake Huron---
Fitzwilliam Is.
PS 615 2 US---Lake Huron---
Manitoulin Is.
PS 496 1 US---Lake Mead (east)
PS 494 1 US---Lake Mead
(west)
PS 599 2 US---Lake Michigan---
Beaver Is.
PS 594 2 US---Lake Michigan---
Manitou Is.
PS 591 2 US---Lake Michigan---
Washington Is.
PS 645 1 US---Lake Ontario
PS 662 2 US---Lake Ontario---
island
PS 667 2 US---Lake Ontario---
island
PS 670 2 US---Lake Ontario---
island
PS 601 1 US---Lake Seminole
PS 618 1 US---Lake St. Clair
PS 550 1 US---Lake Superior
PS 593 2 US---Lake Superior---
Grand Is.
PS 605 2 US---Lake Superior---
island
PS 581 2 US---Lake Superior---
Isle Royale
PS 556 2 US---Lake Superior---
Madeline Is.
PS 595 2 US---Lake Superior---
Michipicoten Is.
PS 558 2 US---Lake Superior---
Oak Is.
PS 563 2 US---Lake Superior---
Outer Is.
PS 583 2 US---Lake Superior---
Pie Is.
PS 559 2 US---Lake Superior---
Stockton Is.
PS 480 1 US---Lake Tahoe
PS 526 1 US---Lake Texoma
PS 587 1 US---Lakes Michigan
and Huron
PS 719 1 US---Long Is.---Great
South Bay
PS 540 4 US---Louisiana
PS 543 1 US---Louisiana---Cal
casieu Lake
PS 584 4 US---Louisiana---Cat
Is.
PS 546 1 US---Louisiana---
Grand Lake
PS 555 4 US---Louisiana---
island
PS 557 4 US---Louisiana---
island
PS 569 4 US---Louisiana---
island
PS 570 4 US---Louisiana---
island
PS 571 4 US---Louisiana---
island
PS 574 4 US---Louisiana---
island
PS 575 4 US---Louisiana---
island
PS 576 4 US---Louisiana---
island
PS 577 4 US---Louisiana---
island
PS 578 4 US---Louisiana---
island
PS 579 4 US---Louisiana---
island
PS 580 4 US---Louisiana---
island
PS 560 1 US---Louisiana---
Lake Maurepas
PS 565 1 US---Louisiana---
Lake Pontchartrain
PS 551 4 US---Louisiana---
Marsh Is.
PS 541 1 US---Louisiana---Sab
ine Lake
PS 561 4 US---Louisiana---Tim
balier Is.
PS 548 1 US---Louisiana---
White Lake
PS 730 5 US---Maine
PS 736 5 US---Maine---island
PS 737 5 US---Maine---island
PS 738 5 US---Maine---island
PS 740 5 US---Maine---island
PS 741 5 US---Maine---island
PS 742 5 US---Maine---island
PS 743 5 US---Maine---island
PS 744 5 US---Maine---island
PS 745 5 US---Maine---island
PS 646 4 US---Maryland
PS 697 4 US---Maryland
PS 698 4 US---Maryland
PS 679 1 US---Maryland---inlet
PS 668 4 US---Maryland---
island
PS 671 4 US---Maryland---
island
PS 673 4 US---Maryland---
island
PS 674 4 US---Maryland---
island
PS 709 4 US---Massachusetts
PS 729 1 US---Massachusetts---
bay
PS 733 1 US---Massachusetts---
inlet
PS 731 4 US---Massachusetts---
Marthas Vineyard
PS 732 4 US---Massachusetts---
Nantucket Is.
PS 592 2 US---Michigan (lower)
PS 564 2 US---Michigan (upper)
PS 524 4 US---Minnesota
PS 531 1 US---Minnesota---
Lake of the Woods
PS 536 4 US---Minnesota---
Lake of the Woods---
island
PS 537 4 US---Minnesota---
Lake of the Woods---
island
PS 539 4 US---Minnesota---
Lake of the Woods---
island
PS 533 4 US---Minnesota---
Lake of the Woods---
land west of lake
PS 547 4 US---Minnesota---lit
tle piece
PS 544 1 US---Minnesota---
Namakan Lake
PS 542 1 US---Minnesota---
Rainy Lake
PS 532 1 US---Minnesota---
Shoal Lake
PS 552 2 US---Mississippi
PS 530 2 US---Missouri
PS 492 5 US---Montana
PS 511 5 US---Nebraska
PS 481 5 US---Nevada
PS 720 3 US---New Hampshire
PS 715 1 US---New Hamp
shire---lake
PS 717 1 US---New Hamp
shire---lake
PS 694 2 US---New Jersey
PS 701 2 US---New Jersey---
island
PS 704 1 US---New Jersey---
Newark Bay
PS 504 5 US---New Mexico
PS 644 3 US---New York
PS 722 3 US---New York---
Fishers Is.
PS 706 3 US---New York---
Long Is.
PS 721 3 US---New York---
Shelter Is.
PS 607 4 US---North Carolina
PS 651 4 US---North Carolina---
Cape Fear
PS 676 4 US---North Carolina---
island
PS 677 4 US---North Carolina---
island
PS 681 4 US---North Carolina---
island
PS 684 4 US---North Carolina---
island
PS 685 4 US---North Carolina---
island
PS 688 4 US---North Carolina---
island
PS 689 4 US---North Carolina---
island
PS 690 4 US---North Carolina---
island
PS 691 4 US---North Carolina---
island
PS 692 4 US---North Carolina---
island
PS 513 3 US---North Dakota
PS 603 4 US---Ohio
PS 515 3 US---Oklahoma
PS 468 3 US---Oregon
PS 638 6 US---Pennsylvania
PS 723 6 US---Rhode Is.
PS 725 6 US---Rhode Is.---
Block Is.
PS 726 6 US---Rhode Is.---
island
PS 727 6 US---Rhode Is.---
island
PS 728 6 US---Rhode Is.---
island
PS 606 1 US---Sault Ste. Marie
PS 614 2 US---South Carolina
PS 512 2 US---South Dakota
PS 703 3 US---Staten Is.
PS 566 3 US---Tennessee
PS 506 2 US---Texas
PS 522 2 US---Texas---island
PS 534 2 US---Texas---island
PS 523 2 US---Texas---Padre Is.
PS 497 3 US---Utah
PS 712 2 US---Vermont
PS 611 2 US---Virginia
PS 675 2 US---Virginia
PS 682 2 US---Virginia
PS 683 2 US---Virginia
PS 672 2 US---Virginia---island
PS 678 2 US---Virginia---island
PS 680 2 US---Virginia---island
PS 695 2 US---Virginia---island
PS 467 2 US---Washington
PS 471 2 US---Washington---
island
PS 472 2 US---Washington---
island
PS 473 2 US---Washington---
island
PS 474 2 US---Washington---
island
PS 475 2 US---Washington---
island
PS 476 2 US---Washington---
island
PS 477 2 US---Washington---
island
PS 620 3 US---West Virginia
PS 545 3 US---Wisconsin
PS 502 4 US---Wyoming
US 247 3 Utah
PO 1097 3 Venezuela
PS 710 3 Venezuela
US 412 2 Vermont
PO 1287 4 Vietnam
PS 929 4 Vietnam
US 331 2 Virginia
US 382 2 Virginia
US 389 2 Virginia
US 390 2 Virginia
US 379 2 Virginia---island
US 385 2 Virginia---island
US 387 2 Virginia---island
US 401 2 Virginia---island
PO 1152 3 Wales
PS 794 3 Wales
US 224 2 Washington
US 227 2 Washington---island
US 228 2 Washington---island
US 229 2 Washington---island
US 230 2 Washington---island
US 231 2 Washington---island
US 232 2 Washington---island
US 233 2 Washington---island
PO 1166 4 West Germany
PS 808 4 West Germany
US 338 3 West Virginia
PO 1128 6 Western Sahara
PS 770 6 Western Sahara
US 277 3 Wisconsin
US 249 4 Wyoming
PO 1245 6 Yemen (Aden)
PS 887 6 Yemen (Aden)
CO 138 2 Yemen (Aden)---
Socotra (island)
PO 1256 6 Yemen (Aden)---
Socotra (island)
PS 898 6 Yemen (Aden)---
Socotra (island)
PO 1243 5 Yemen (Sana)
PS 885 5 Yemen (Sana)
PO 1193 4 Yugoslavia
PS 835 4 Yugoslavia
PO 1190 6 Zaire
PS 832 6 Zaire
PO 1209 5 Zambia
PS 851 5 Zambia
PO 1214 3 Zimbabwe
PS 856 3 Zimbabwe
----------------------------------------------
Previous Chapter Tutorial Home Next Chapter